
Dubai’s real estate market began January 2026 by setting historic records, reaching its highest ever monthly transaction value. The market has transitioned from a speculative boom into a more mature phase driven by end users, long term residents, and a population that has officially surpassed 4 million.
If that sounds like marketing fluff, I get it, it often does. But the numbers this month make it hard to dismiss. For example, Dubai Land Department figures reported in the press put total real estate transactions for January at AED 107.96B, with sales alone at AED 72.5B, and 17,457 sales deals completed. And on the demand side, the population milestone is not just a headline, it is a measurable pressure on housing, schools, roads, and rental stock.
One quick note before we dive in, because it matters. Different reports use different definitions. Some dashboards focus on sales only, others bundle sales, mortgages, and gifts, and some include categories differently. So when you see slight variation between “transaction value” and “sales value”, that is usually why.
I’m happy to be the second opinion.
If you’re already talking to someone or looking at a specific unit, send it over, I’ll tell you what I’d check and what questions to ask.
Market snapshot, January 2026
Here’s the cleanest way to absorb the month, in one place.
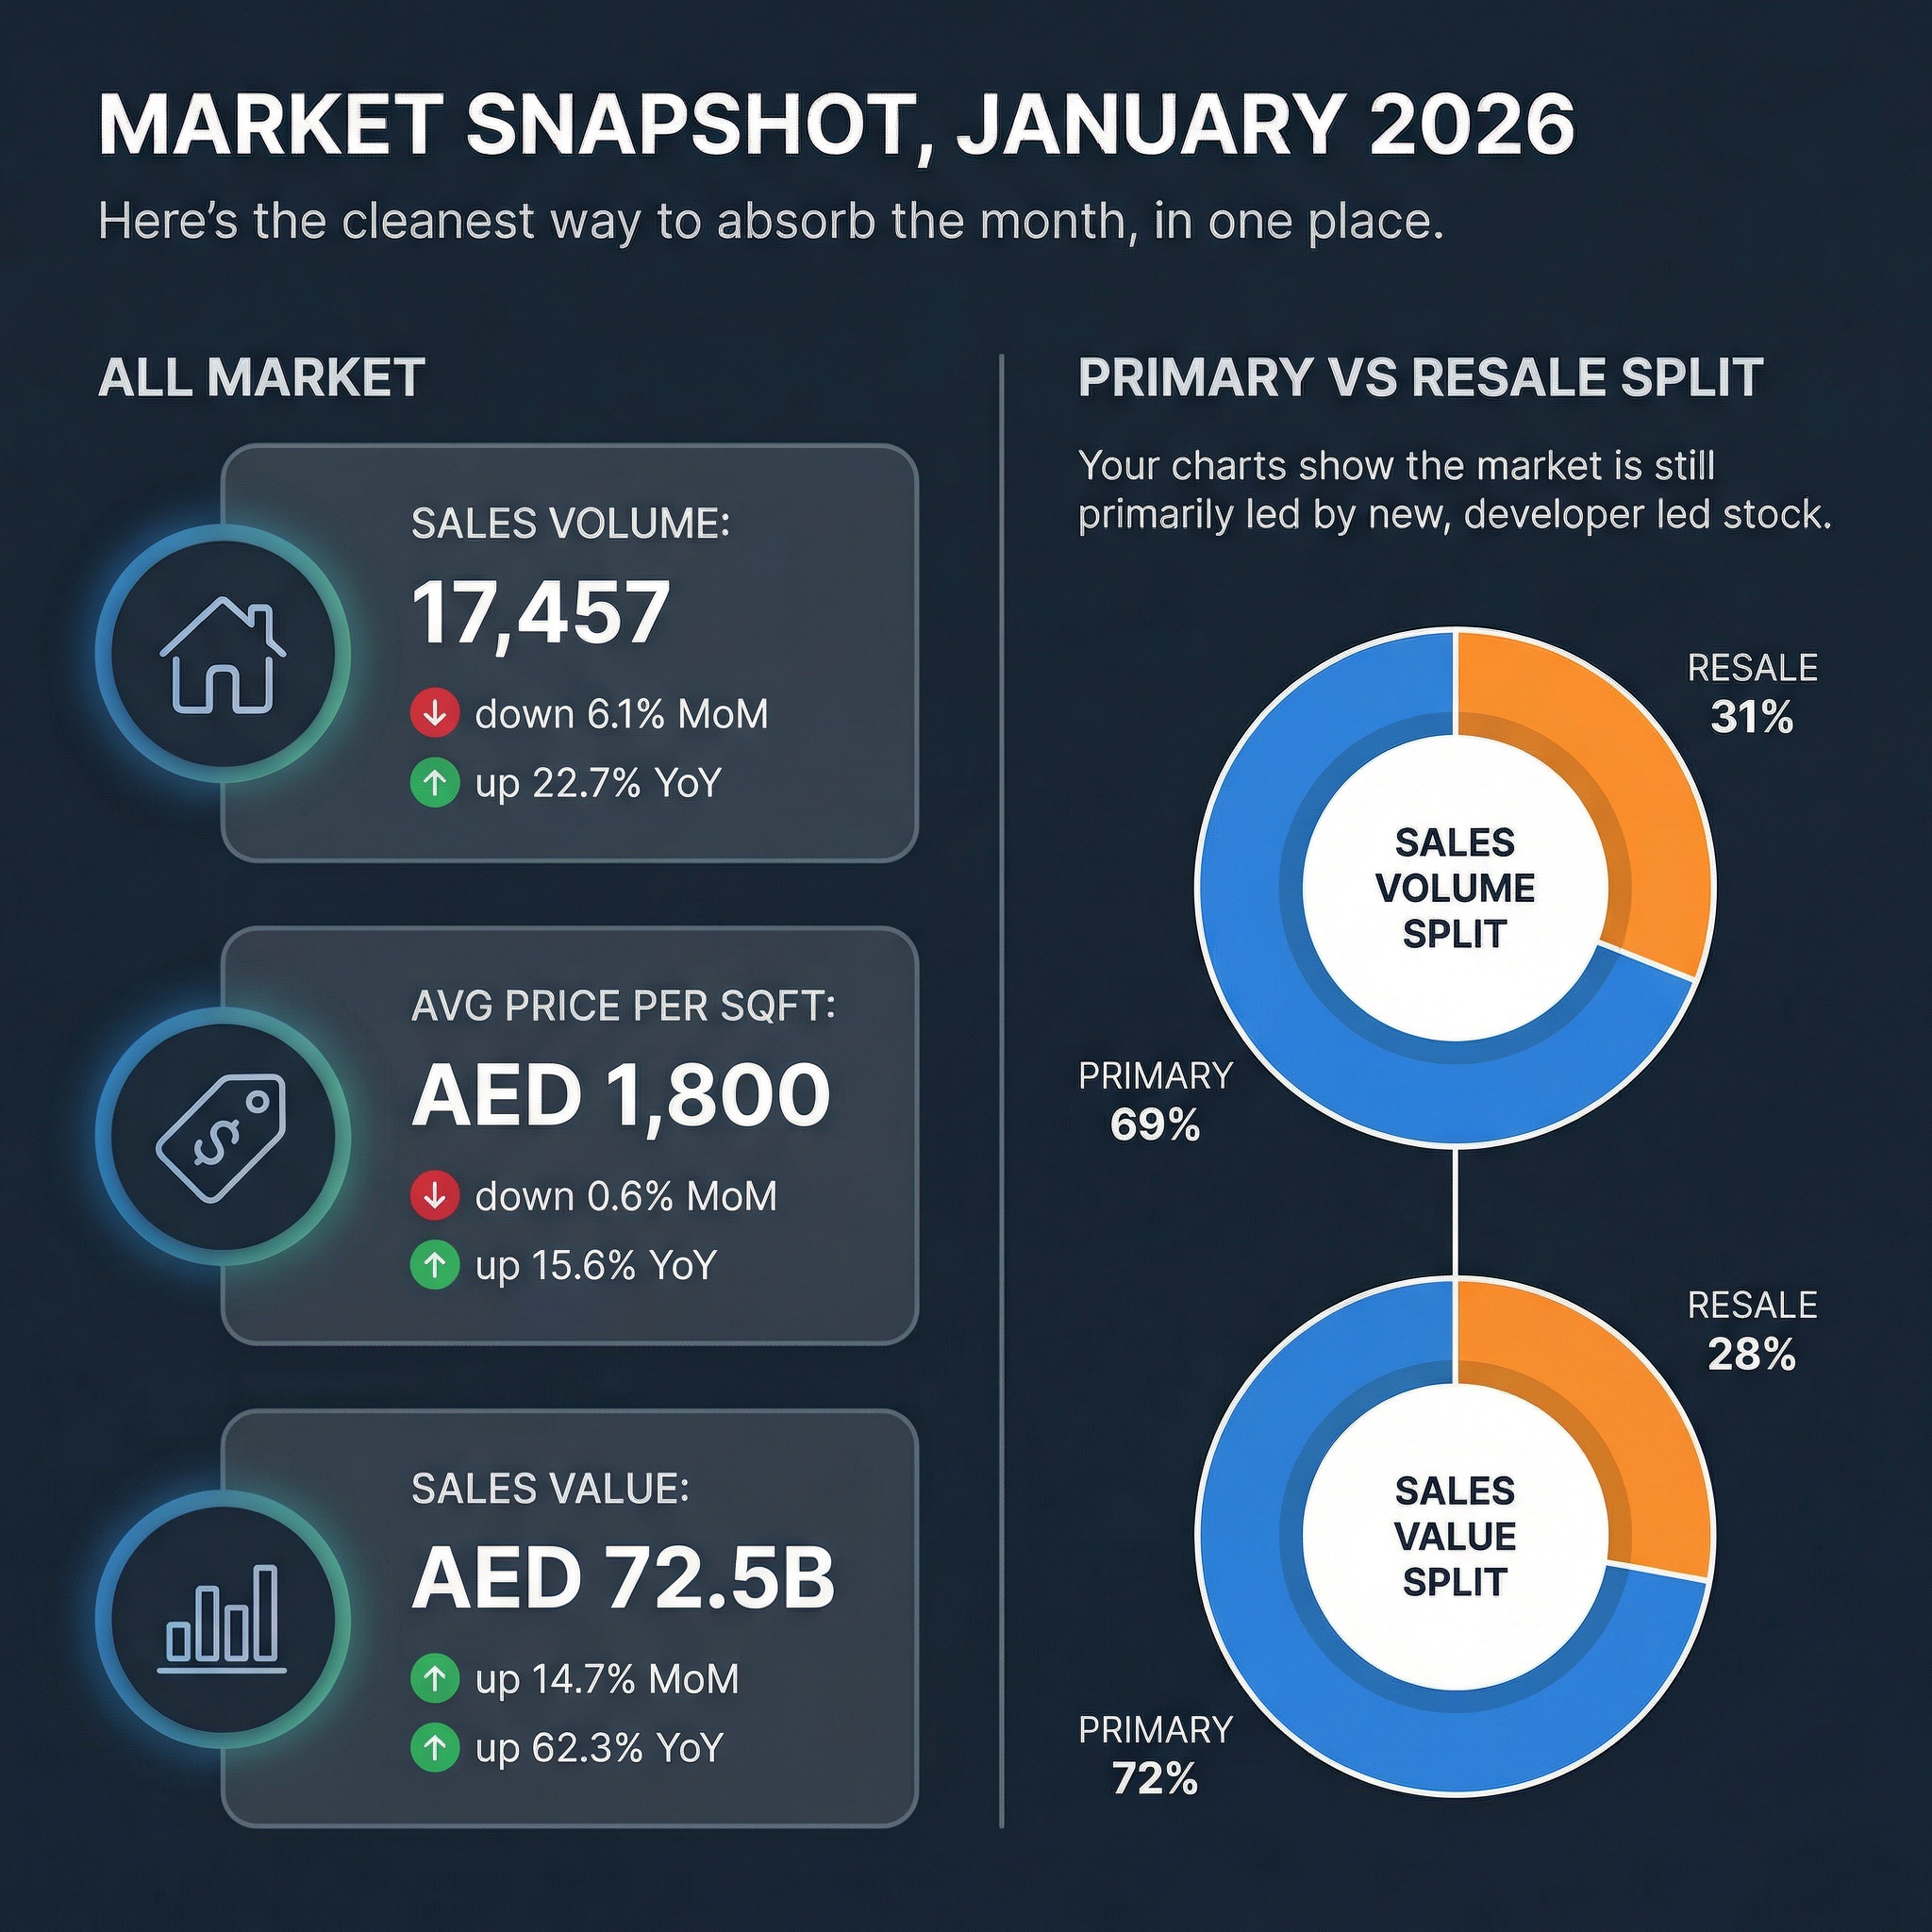
All market
- Sales volume: 17,457, down 6.1% MoM, up 22.7% YoY
- Avg price per sqft: AED 1,800, down 0.6% MoM, up 15.6% YoY
- Sales value: AED 72.5B, up 14.7% MoM, up 62.3% YoY
Primary vs resale split
This shows the market is still primarily led by new, developer led stock.
- Sales volume split: 69% primary, 31% resale
- Sales value split: 72% primary, 28% resale
That split tells a story, primary is not only winning on volume, it is also winning harder on value, which usually means one thing, buyers are paying up for newer product, better payment plans, and future location premiums.
All vs Primary vs Resale, side by side
| Segment | Sales volume | MoM | YoY | Avg price per sqft | MoM | YoY | Sales value | MoM | YoY |
|---|---|---|---|---|---|---|---|---|---|
| All | 17,457 | -6.1% | +22.7% | AED 1,800 | -0.6% | +15.6% | AED 72.5B | +14.7% | +62.3% |
| Primary | 12,095 | -10.2% | +32.0% | AED 1,850 | -0.3% | +14.6% | AED 52.0B | +18.6% | +97.3% |
| Resale | 5,362 | +4.8% | +6.0% | AED 1,540 | -1.2% | +6.5% | AED 20.5B | +6.0% | +11.9% |
How I read this, in plain English. Primary cooled MoM, but remains the growth engine YoY. Resale is steadier, less explosive, and slightly softer on pricing MoM, which is normal when more buyers are being tempted by developer incentives.
What actually sold, by property type
This is where the market gets interesting, because it is not one market, it’s a few markets moving at different speeds.
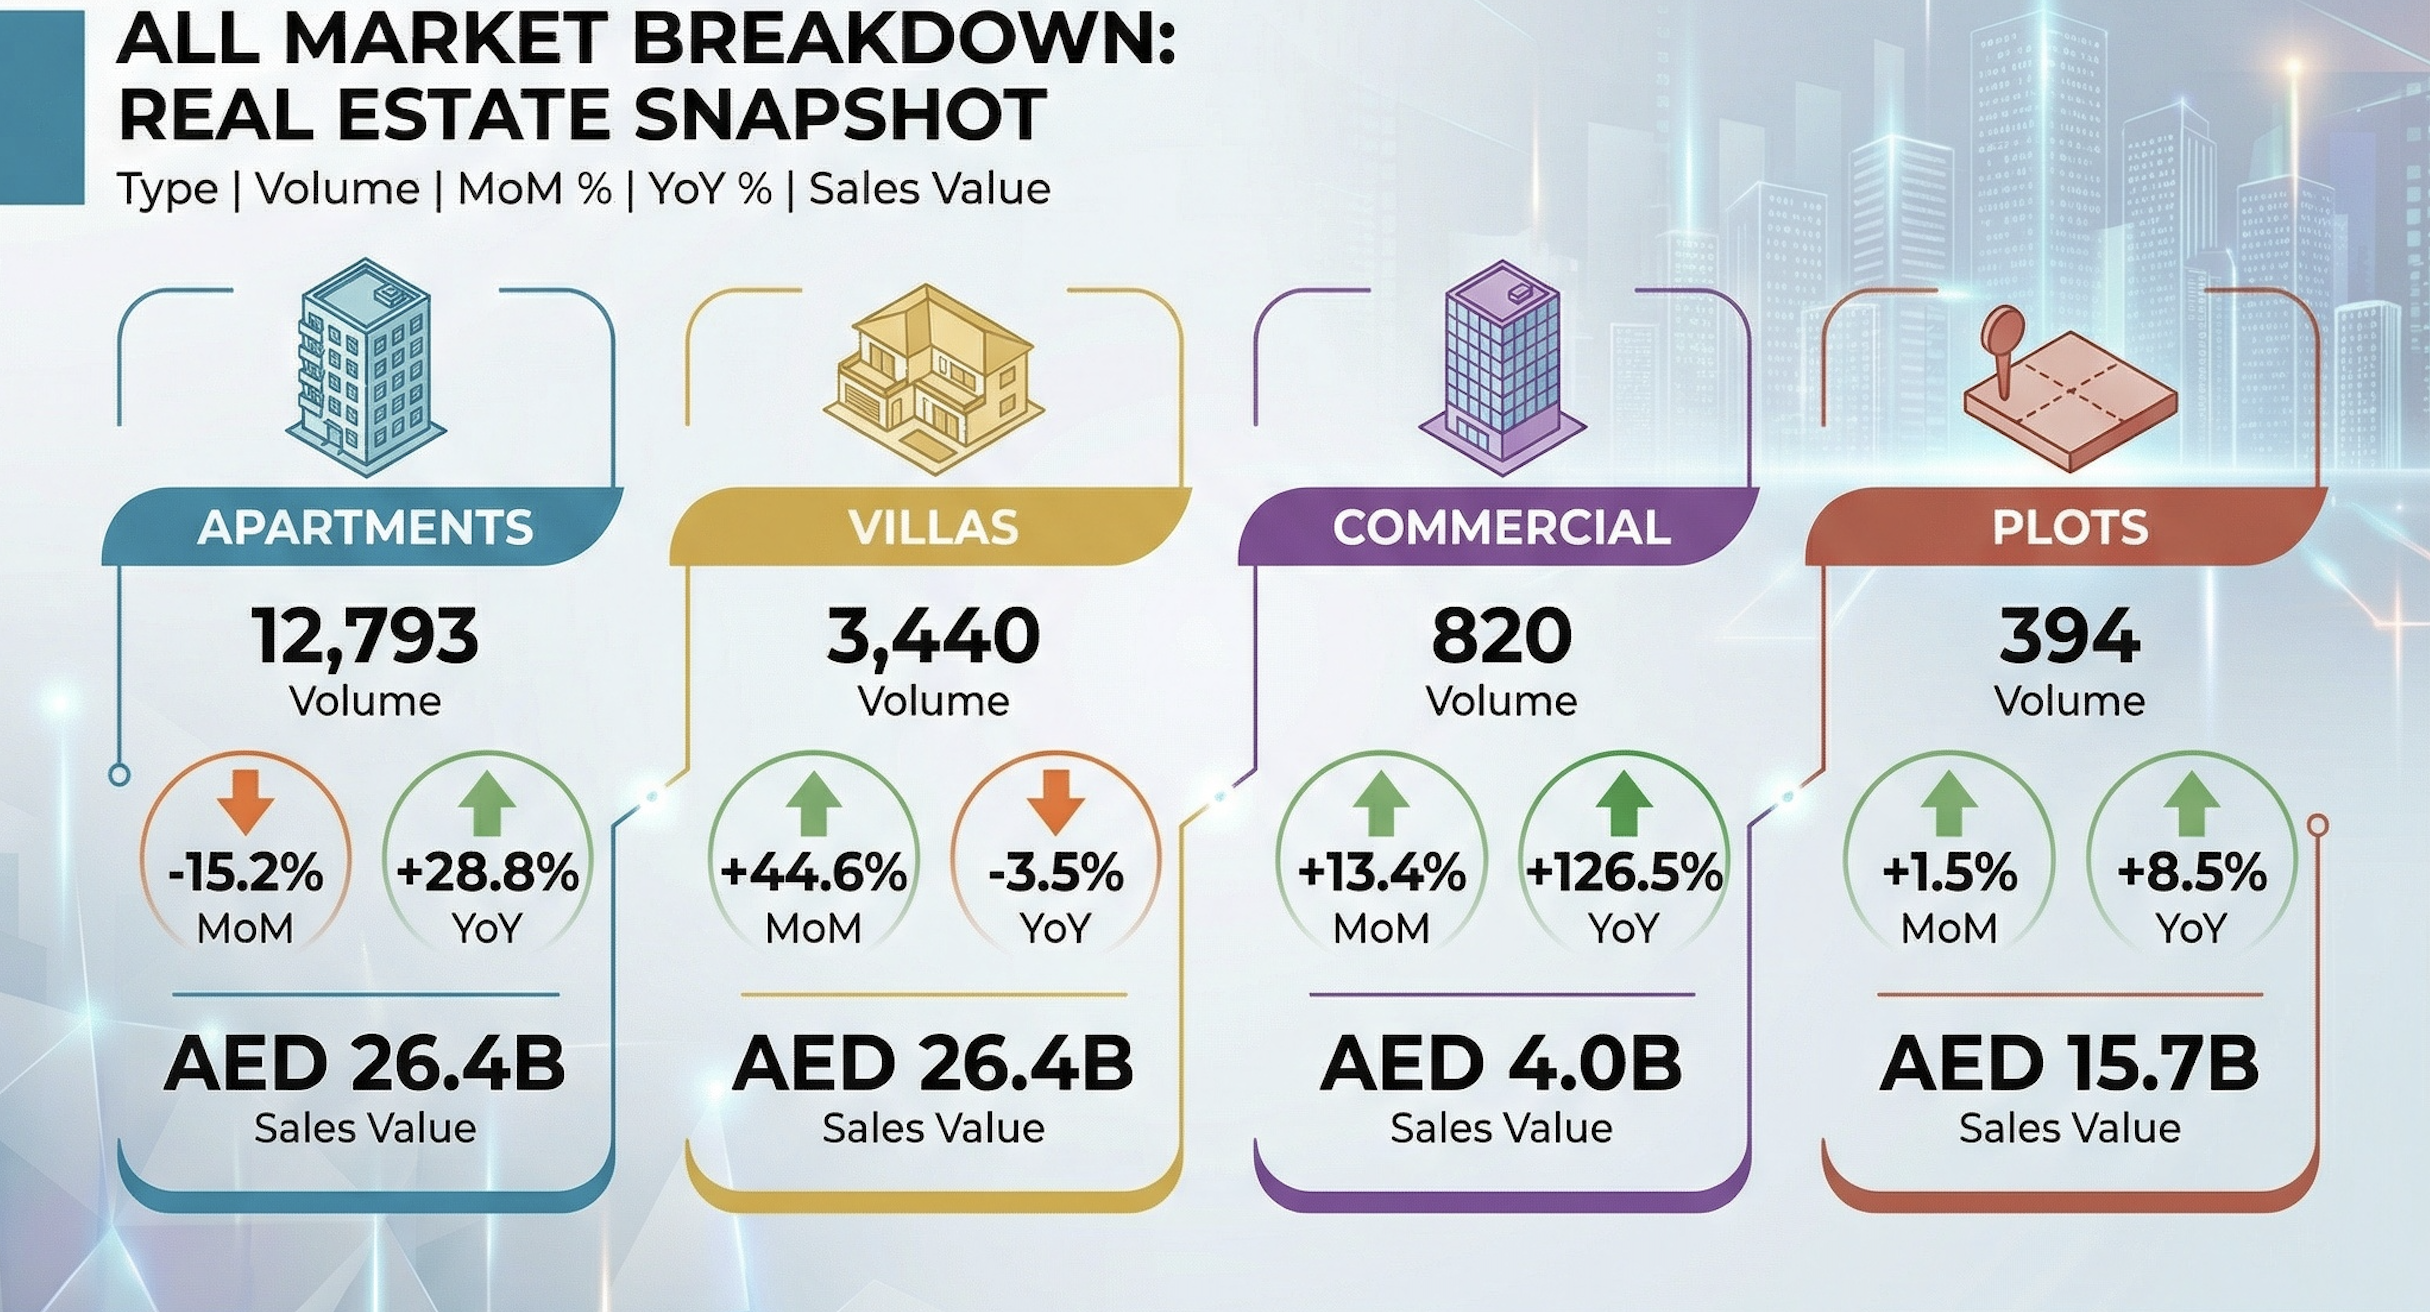
All market breakdown
| Type | Volume | MoM | YoY | Sales value |
|---|---|---|---|---|
| Apartments | 12,793 | -15.2% | +28.8% | AED 26.4B |
| Villas | 3,440 | +44.6% | -3.5% | AED 26.4B |
| Commercial | 820 | +13.4% | +126.5% | AED 4.0B |
| Plots | 394 | +1.5% | +8.5% | AED 15.7B |
Two quick reactions.
First, apartments remain the liquidity king. They dominate volume, even in months where villas steal the headlines. Second, villa volume spiked MoM, while YoY dipped slightly, which suggests a more episodic pipeline, launches, bulk buys, or a few large transactions swinging the month.
And commercial, the YoY jump is hard to ignore. It’s still smaller in absolute value, but it often acts like a confidence indicator when it accelerates.
Want the “what would you do if it was your money” answer?
Message me your situation, timeline, and risk tolerance, I’ll respond honestly and back it with the data.
The “record January” context, and why it matters
Press coverage of January’s record month leaned heavily on total transaction value, not just sales. That includes mortgages and gifts too, which is why the headline number is bigger than “sales value”.
But even if you strip it back to sales only, AED 70.05B in a single month is not a casual milestone, it is a statement about depth.
This is where the “mature phase” argument becomes more believable.
- More residents are staying longer, and buying instead of renting forever
- More global capital is treating Dubai as a base, not a quick flip location
- More development is aligned with long term infrastructure, not just towers for towers’ sake
Even outside real estate media, you can see the same theme, big institutional confidence in long horizon infrastructure and business districts.
The long cycle view, 2014 to 2026 in two charts
Your charts show two very human things about this market.
1) Sales activity has moved into a higher gear
Annual monthly January sales volume rises sharply post 2022, culminating in the highest bar in 2026. Even with normal seasonal bumps, the step change is visible.
2) Prices per sqft have clearly broken above the old range
Price per sqft goes from AED 918 in 2014 to AED 1,796 in 2026, with the post 2022 leg doing most of the heavy lifting.
That kind of move can be read two ways, depending on your personality.
One view, the optimistic one, is that this is a repricing of Dubai into a “global city” valuation band as population, business inflows, and lifestyle infrastructure mature.
The more cautious view is that rapid repricing eventually forces buyers to become pickier, meaning the next phase is less about “Dubai goes up”, and more about micro location selection, developer quality, unit orientation, and exit liquidity.
Honestly, I lean toward the second view as the more useful one for investors. It’s not bearish, it’s just practical.
Rentals, mortgages, price bands, top areas, and what buyers are actually doing
If January 2026 is a “record month”, the obvious question is, record because of what, more buyers, bigger tickets, or just higher prices?
The answer is, a bit of all three, which is annoying because it ruins any simple narrative. But it’s also why this market feels more mature than the boom cycles people love to compare it to.
This section breaks down rental signals, mortgage activity, the price ranges where demand is concentrating, and the specific areas and projects that carried the month. Then we turn that into something actionable, how to think about primary vs resale right now.
Rental prices, a quiet but important signal
Sales data gets the headlines, but rentals are where you feel the market’s actual “population pressure”. Even if you are a pure investor, rents tell you how sustainable the demand is.
Here are your rental numbers for January 2026:
| Segment | Average rent | Change vs previous month |
|---|---|---|
| Apartment | AED 71K | +1.4% |
| Villa | AED 190K | +8.6% |
| Commercial | AED 65K | -9.7% |
What it suggests, in plain terms:
- Apartments are still rising, but calmly. That is usually healthy.
- Villas are doing that thing they do in Dubai, they move in bursts. An 8.6% jump is meaningful, and it aligns with a market where family end users are increasingly driving decisions.
- Commercial softness is not automatically bearish. Sometimes it simply reflects a mix shift in assets transacting, renewals, or new supply. Still, it is worth tracking alongside office vacancy and business registrations.
Prices per sqft are up strongly YoY, so rents need to keep following, or yields compress. That does not kill returns, it just changes which micro locations still work.
Mortgage activity, what the financing data really tells us
Mortgage data is one of the best “reality checks” because it’s harder to fake. Cash buyers can move quickly and chase launches, mortgage buyers tend to be end users and longer term holders, and banks impose friction.
Your January mortgage snapshot:
| Metric | January 2026 | YoY change |
|---|---|---|
| Mortgage value | AED 13.5B | +19.8% |
| Mortgage transactions | 2,703 | -33.5% |
At first glance, that looks contradictory, higher value, fewer transactions. But it can happen if:
- average loan size increased, or
- fewer mortgages were taken, but for higher priced homes, or
- a larger share of buyers used cash, while financed buyers shifted toward premium stock.
The way I would phrase this in the blog, without pretending certainty, is like this:
Mortgage value rose, but the number of mortgage deals fell, which hints at a market where financing is concentrating into bigger ticket purchases, while a meaningful share of transactions remain cash or developer payment plan driven.
That’s a good “mature market” signal, actually.
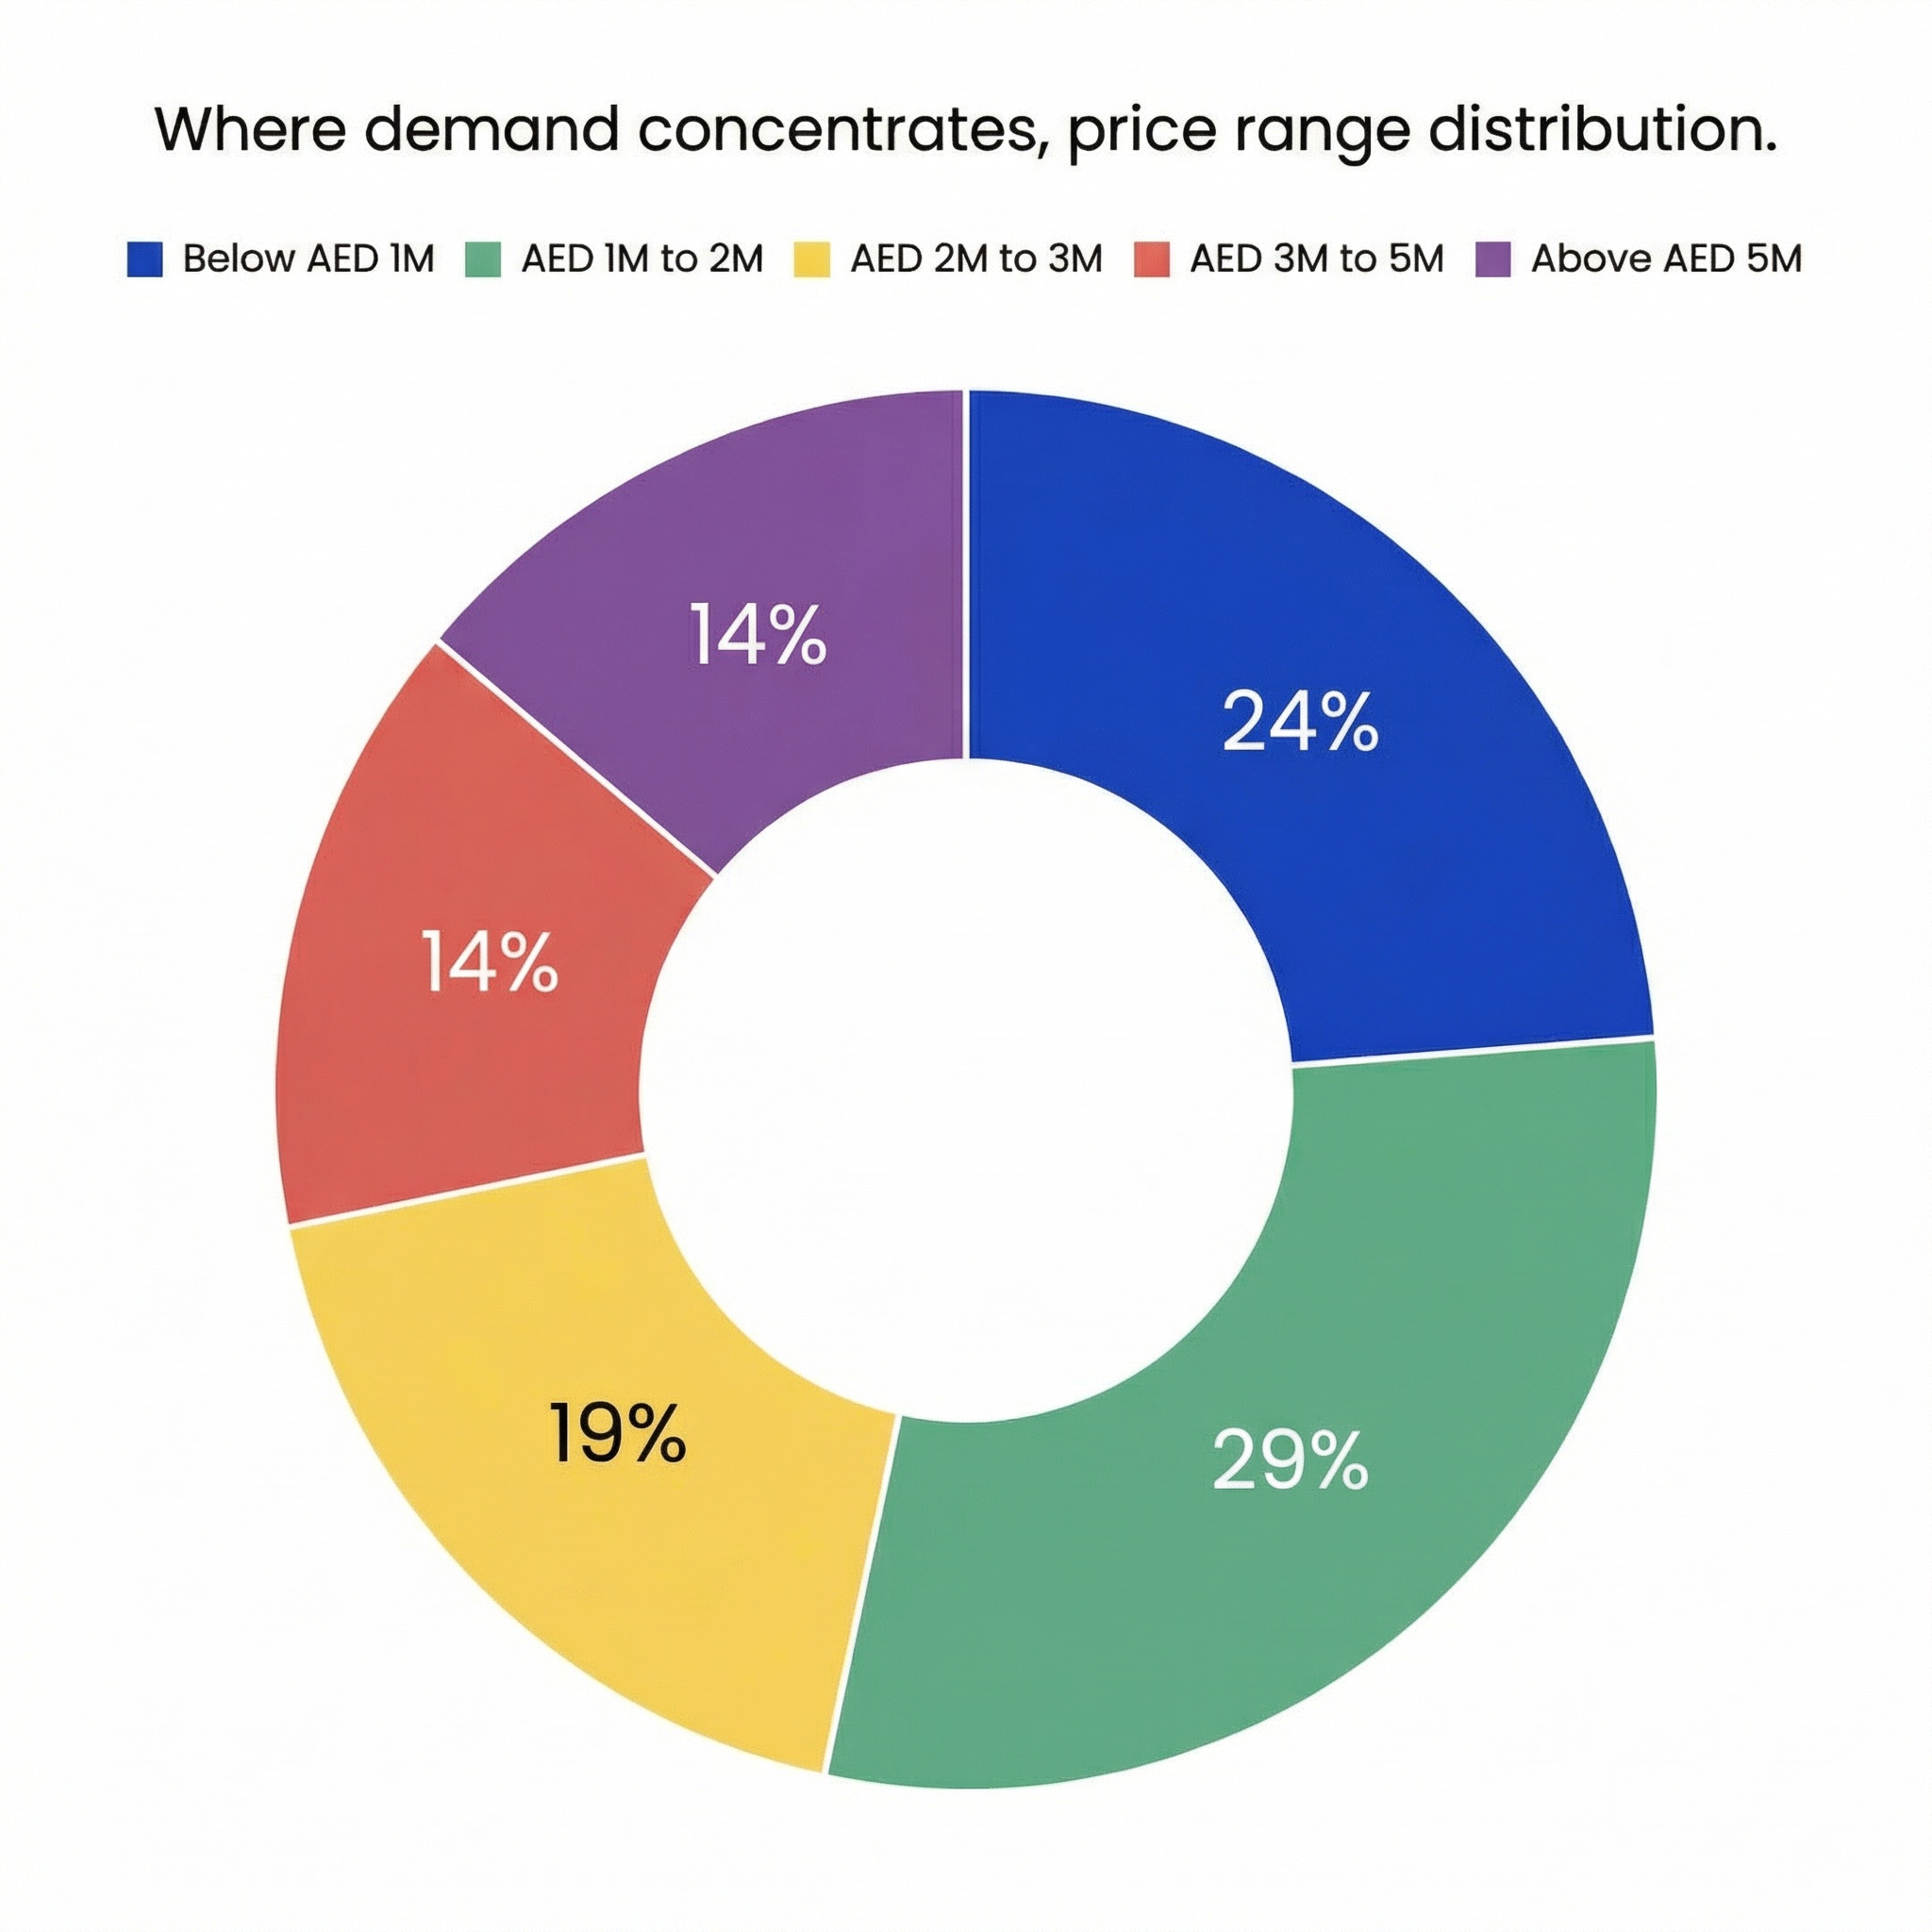
A few takeaways that are simple, but useful:
- The “core” liquidity zone is still AED 1M to 2M.
That 29% share matters because liquidity is your exit strategy. Even if you buy premium, you want to understand where the broadest buyer pool sits. - The market is not just end users buying entry units.
The fact that 14% is above AED 5M is a real indicator of high ticket strength. - Mid market strength supports off plan absorption.
Developers love that AED 1M to 3M range because it sells faster, and it can be packaged with attractive payment plans.
Primary vs resale, what changes for an investor in 2026
Let’s talk about the obvious split in your charts.
- Primary dominates volume, and dominates value even more.
- Resale is growing YoY, but not at the same velocity.
That does not mean resale is “weak”. It means buyers are being incentivized toward primary.
Why primary is winning right now
- Payment plans reduce the monthly burden. Buyers mentally compare installments, not just price.
- Newer inventory fits the “Dubai lifestyle” demand. Layouts, amenities, building management, all matter more than people admit.
- Launch pricing and perceived upside. Even if you and I know not every launch is a bargain, buyers still chase the idea of getting in early.
Tell me your timeline, I’ll help you choose between primary and resale and show you the numbers.
Why resale still matters, and where it wins
- Immediate rental income. Off plan has a timeline, resale can cashflow now.
- Known building, known view, known noise. That sounds small, but it is huge for tenant stability.
- Negotiation leverage. In some pockets, sellers will negotiate in ways developers simply do not.
If you want a clean investor framework, use this decision rule:
- Choose primary when you want payment plan leverage, upside from handover, and you are comfortable underwriting developer execution risk.
- Choose resale when you want immediate yield, lower uncertainty, and you are buying something already “proven” in the rental market.
Not perfect, but practical.
Primary market price overview, what it costs now
Primary, median price by type
| Type | Median price | vs 2025 | vs 2014 |
|---|---|---|---|
| Apartment | AED 1.4M | +2.1% | +65% |
| Plot | AED 2.8M | -29% | -43% |
| Villa | AED 4.1M | +54.6% | +26.6% |
That villa jump vs 2025 is big, and it matches the “family end user” narrative, but I would also call out that one month can be skewed by what transacted. It’s still meaningful, I just would not oversell it.
Primary, price per sqft by type
| Type | Price per sqft | vs 2025 | vs 2014 |
|---|---|---|---|
| Apartment | AED 1,845 | +5.5% | +86.6% |
| Plot | AED 167 | -54.4% | -62.1% |
| Villa | AED 1,822 | +27% | +146.5% |
Apartment and villa price per sqft are close, but the total ticket size is very different because villas carry land and larger built up area. It’s worth saying out loud so readers do not misinterpret.
Resale market price overview, what buyers paid in the secondary market
Resale, median price by type
| Type | Median price | vs 2025 | vs 2014 |
|---|---|---|---|
| Apartment | AED 1.2M | 0% | +13.4% |
| Plot | AED 6.4M | -7.7% | +8.4% |
| Villa | AED 4.2M | +7.7% | +42.9% |
Resale, price per sqft by type
| Type | Price per sqft | vs 2025 | vs 2014 |
|---|---|---|---|
| Apartment | AED 1,541 | +2.7% | +42.2% |
| Plot | AED 720 | +25.4% | +44% |
| Villa | AED 1,561 | +10.6% | +122.2% |
Resale apartments look comparatively steady, which I actually like as an investor. It reads like a market where secondary product is repricing gradually, while primary absorbs the excitement premium.
If you’re aiming for liquidity, tell me your price band and I’ll recommend where demand is strongest.
Dubai property sales value by category, what actually drove the dirhams
- Apartment 36%
- Villa 36%
- Plot 22%
- Commercial 5%
- Building 0%
Still, the spirit is clear, apartments and villas dominate, and plots are a huge contributor by value when big land deals close.
By value, villas, apartments, and plots captured the bulk of market activity, with commercial forming a smaller but fast growing slice.
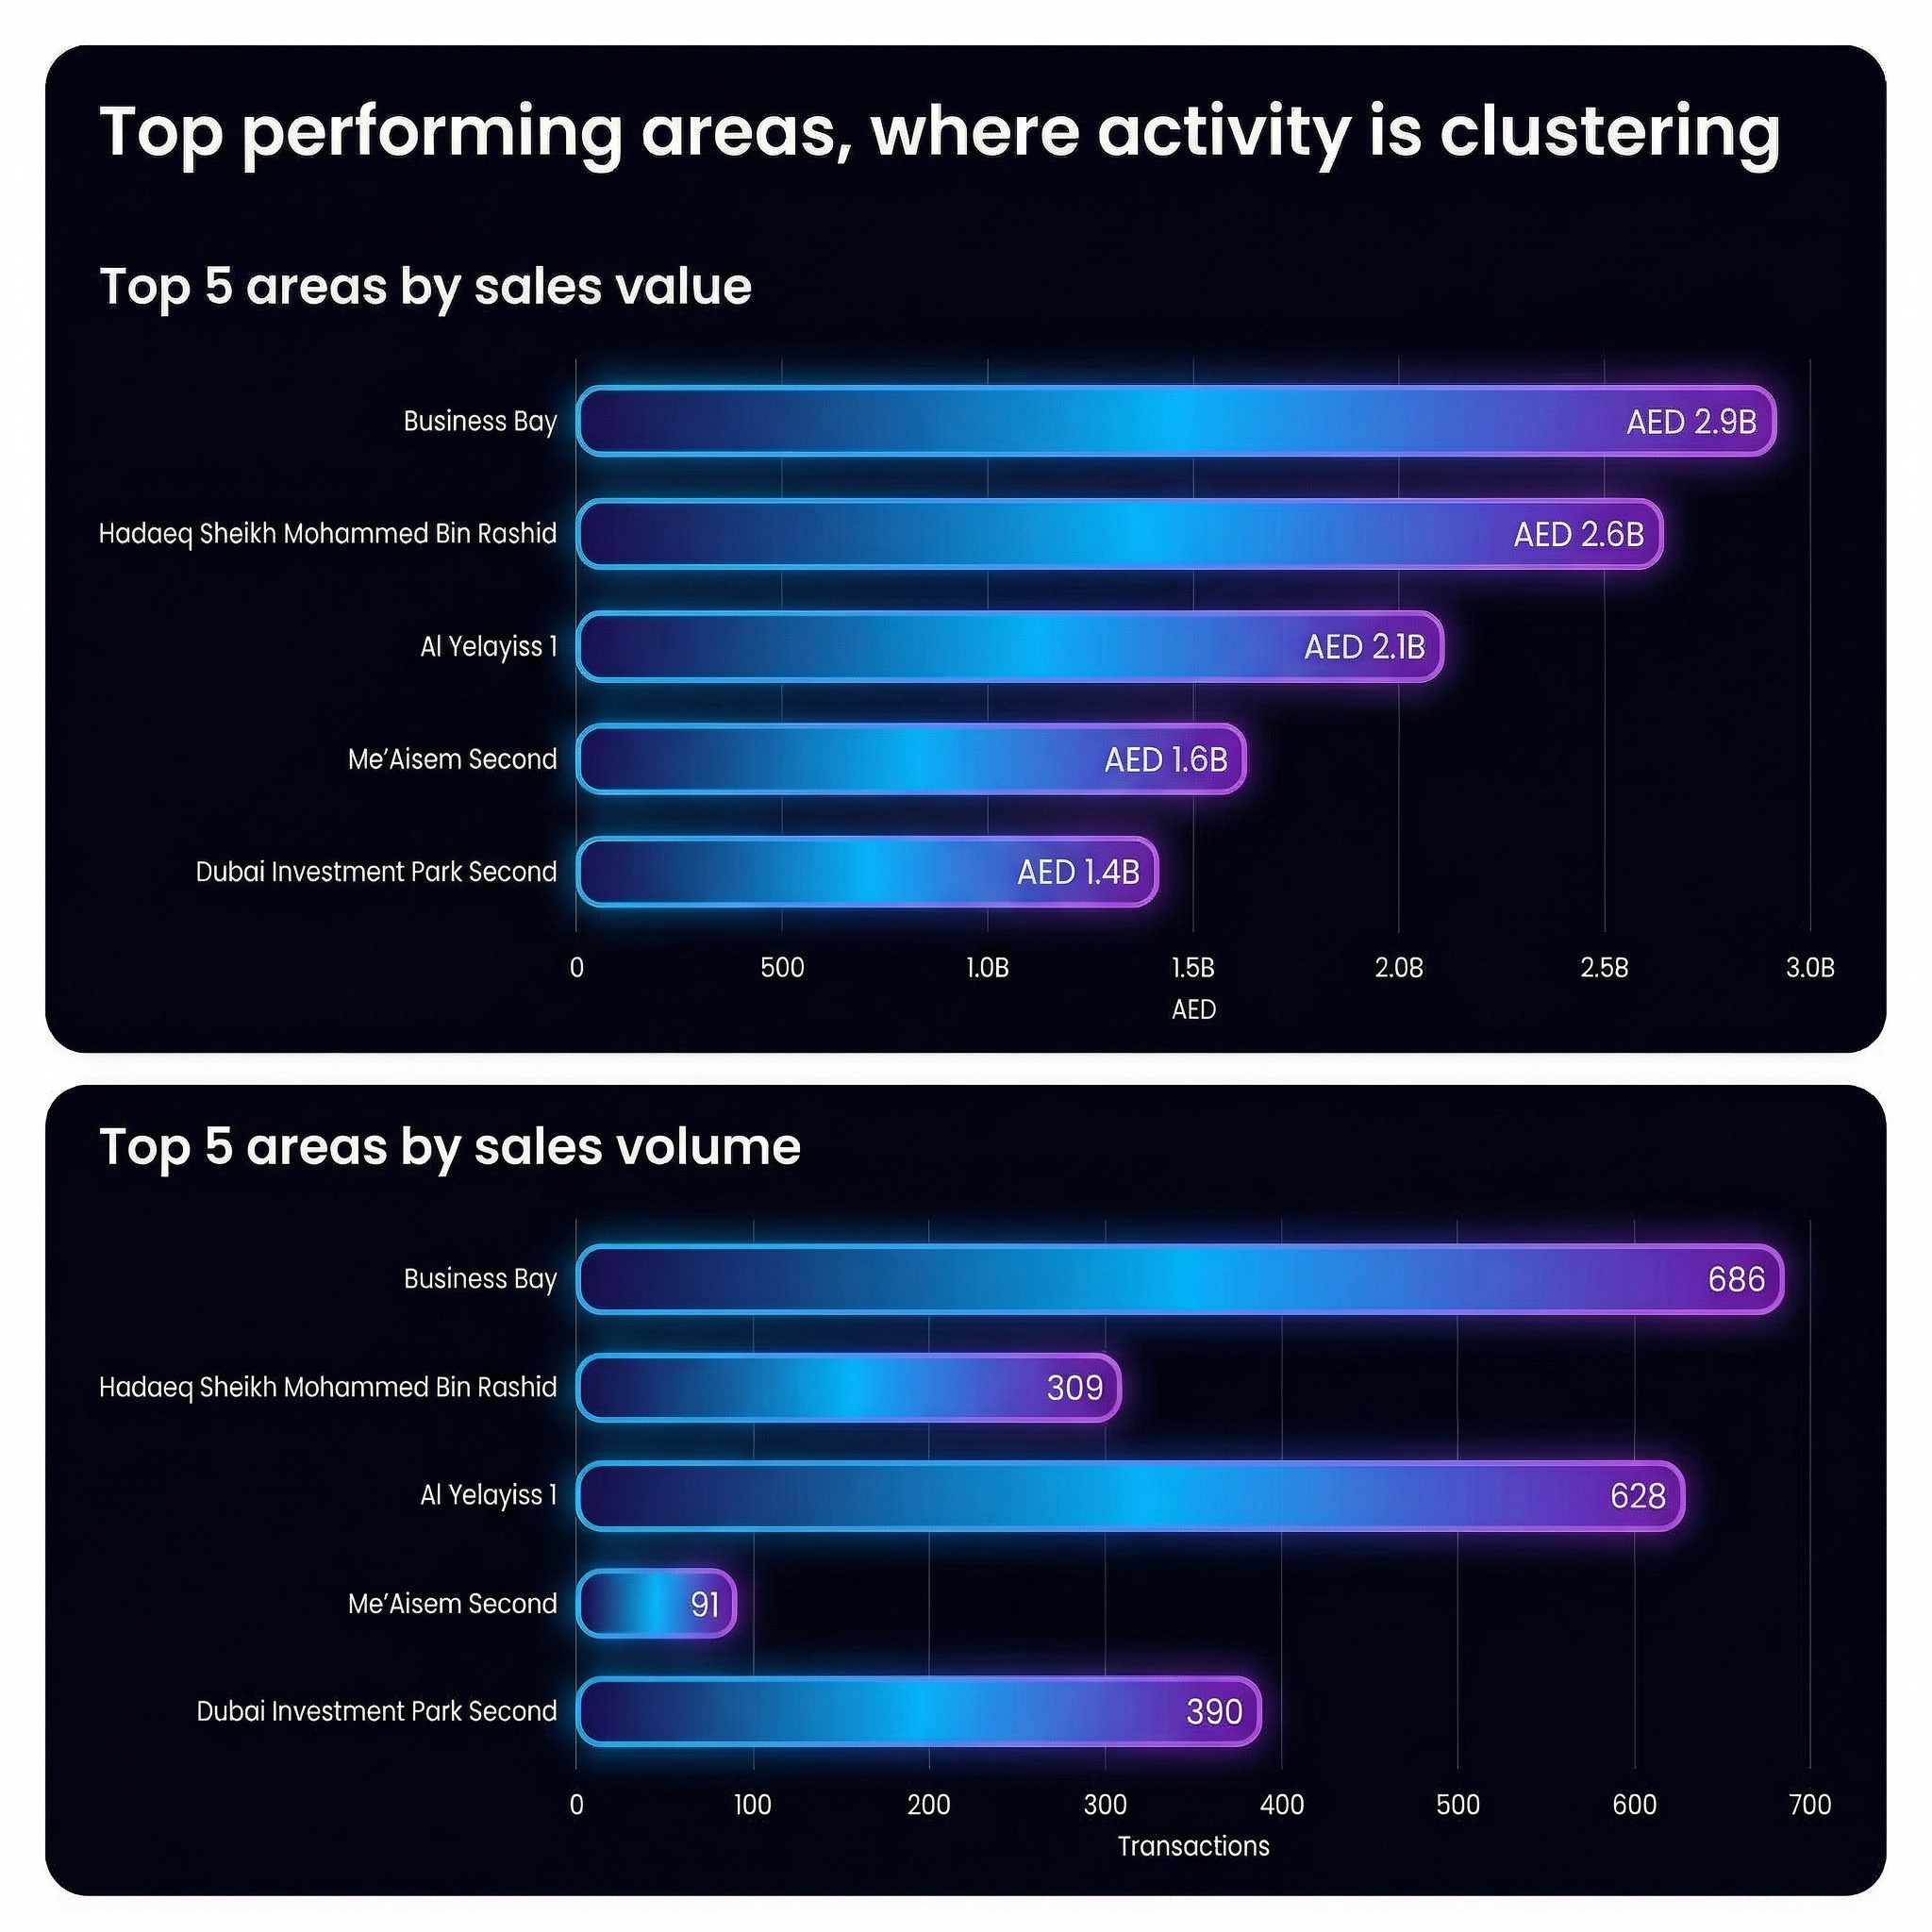
How to explain this to readers:
- Business Bay is doing what it always does, it mixes end users, investors, and premium positioning, so it tends to show up in both value and volume.
- The presence of land and villa driven districts in these lists supports the idea that 2026 demand is not only “tower buyers”, it’s also families and developers positioning for the next cycle.
Luxury outliers, the sales that define the top end narrative
Top 5 most expensive apartments sold
| Price | Project, area |
|---|---|
| AED 72M | Aman Residences Dubai, Tower 1, Jumeirah Second |
| AED 44M | Solaya 1, Jumeirah First |
| AED 42M | Serenia Living, Tower 4, Palm Jumeirah |
| AED 39M | Solaya 6, Jumeirah First |
| AED 37M | Solaya 3, Jumeirah First |
Top 5 most expensive villas sold
| Price | Area |
|---|---|
| AED 96M | Hadaeq Sheikh Mohammed Bin Rashid |
| AED 91M | Palm Jumeirah |
| AED 85M | Jumeirah Bay |
| AED 73M | Wadi Al Safa 3 |
| AED 71M | World Islands |
I always hesitate to over interpret trophy deals, because a few sales do not define the whole market. Still, they matter as a signal. When the top end is active, it tends to lift confidence across the ladder.
Best selling projects, what moved in volume
Primary market, apartments
| Project | Volume | Value | Median price |
|---|---|---|---|
| Saas Hills | 62 | AED 130.3M | AED 1.8M |
| The Palesides | 62 | AED 398.2M | AED 4.4M |
| Terra Gardens, Building 2 | 61 | AED 124.5M | AED 2.3M |
| Terra Gardens, Building 1 | 44 | AED 81.4M | AED 1.6M |
| Damac Riverside, all buildings | 42 | AED 65.4M | AED 1.4M |
Primary market, villas
| Project | Volume | Value | Median price |
|---|---|---|---|
| Al Yelayiss 1 | 599 | AED 2.0B | AED 2.9M |
| Dubai Investment Park Second | 234 | AED 1.1B | AED 3.8M |
| Me’Aisem Second | 83 | AED 1.5B | AED 15.6M |
| Al Yufrah 1 | 76 | AED 526.8M | AED 7.2M |
| Eden Hills | 73 | AED 1.9B | AED 22.2M |
Resale, apartments
| Project | Volume | Value | Median price |
|---|---|---|---|
| Azizi Riviera, all buildings | 41 | AED 40.3M | AED 760K |
| Sobha Hartland, The Crest | 26 | AED 50.7M | AED 1.9M |
| Miracle Residence | 23 | AED 13.9M | AED 695.8K |
| Qpoint Liwan | 23 | AED 14.7M | AED 595K |
| The First Collection, Dubai Sports City | 21 | AED 25.8M | AED 1.1M |
Resale, villas
| Project | Volume | Value | Median price |
|---|---|---|---|
| Al Furjan | 16 | AED 97.9M | AED 5.7M |
| Mudon Al Ranim 3 | 13 | AED 52.0M | AED 3.7M |
| Jumeirah Park | 12 | AED 149.0M | AED 11.5M |
| Jumeirah Village Triangle | 10 | AED 44.6M | AED 5.0M |
| The Villa | 10 | AED 82.3M | AED 8.0M |
If you’ve read this far, you’re probably taking the decision seriously. Send me your budget and whether you want primary or resale, I’ll reply with a clear plan and a few options that actually fit.
What could cool the cycle, how to pick areas in 2026, and an investor checklist
Before we get tactical, I want to ground one thing.
January 2026 was not just “good”. It was widely reported as a record month, with transaction value hitting new highs and sales deals exceeding last year’s January. Data dashboards like DXB Interact also frame January 2026 as a continuation of a multi year upswing in volume, value, and pricing.
That said, a market can be strong and still have weak spots. In fact, the stronger it gets, the more important selection becomes.
So this final batch does three things:
- It lists the realistic risks, the stuff that can cool sentiment or compress returns.
- It gives you a practical area scoring framework investors can actually use.
- It ends with a clean investor checklist, plus the remaining SEO packaging, meta, structure, and schema.
What could cool Dubai’s property market in 2026
I’m not here to write a doom section. Dubai can stay strong and still deliver excellent returns. But if you publish a market overview without a risk lens, sophisticated readers quietly stop trusting it.
Here are the most credible cooling factors, explained in normal language.
1) Supply timing and handover waves
The market can digest a lot of supply, until it cannot, and then you see it first in rent concessions and longer vacancy, not in headlines.
The practical risk is not “oversupply everywhere”. It’s oversupply in specific micro pockets, at specific unit types, arriving in a tight handover window. That’s why selection needs to be unit level, not just area level.
2) Affordability and yield compression
Your numbers show prices per sqft up strongly YoY, while apartment rents are rising more slowly. That can still work, it just means yields compress unless the unit is purchased at a discount, or has unusually strong tenant demand.
This is where investors get tripped up. They see price appreciation and assume yield stays the same. It often does not.
3) Interest rates and mortgage friction
Even if Dubai has a large cash buyer base, financing still matters because it sets the marginal buyer’s ceiling.
Your mortgage snapshot, higher value but fewer mortgage transactions, is a clue that credit conditions and buyer composition are shifting. If rates stay restrictive or underwriting tightens, resale liquidity can slow first.
4) Global risk sentiment and capital flows
Dubai benefits from being a “safe base” for global capital, but that also means it’s sensitive to international sentiment, geopolitics, and risk off cycles.
This is not a prediction, it’s just the reality of a globally connected market.
5) Policy changes, fees, or regulatory tightening
Dubai has built trust by improving transparency and process over time. But any meaningful increase in transaction friction, fees, or lending rules can slow the market temporarily.
It’s usually not permanent damage, it’s a pause. Still, investors feel it.
6) The market becomes more selective, and hype stops working
This is the one I see in real life, and I admit I’m biased because I’ve watched buyers get burned by “shiny launch syndrome”.
When a market matures, average product stops winning automatically. Buyers start asking:
- Who is the developer, really.
- What is the service charge range.
- What is the tenant profile.
- How many similar units are delivering nearby.
That shift is healthy. It just means the strategy must evolve.
A simple area scoring framework investors can use in 2026
Here’s a scoring model you can publish in the blog that feels actionable, and it’s friendly for AI summaries because it is structured.
Area Scorecard, 8 factors, 40 points total
| Factor | What it measures | Score (0 to 5) |
|---|---|---|
| Liquidity | How easy it is to resell, tenant depth, transaction volume | 0-5 |
| Rental demand | Tenant pool strength, vacancy risk, rent resilience | 0-5 |
| Supply risk | Near term handover volume, competing inventory | 0-5 |
| Price to value | Entry pricing vs comparable alternatives | 0-5 |
| Infrastructure catalysts | Transport links, business hubs, lifestyle upgrades | 0-5 |
| Developer quality | Delivery history, build quality, management | 0-5 |
| Unit differentiation | Views, layouts, scarcity, corner units, high floors | 0-5 |
| Exit flexibility | Can you sell to end users and investors, broad buyer pool | 0-5 |
How to use it in practice
-
32 to 40 points, strong investment grade, you can be patient and still win.
-
24 to 31 points, workable, but only if the unit is priced right.
-
Under 24 points, you need a clear edge, a steep discount, a unique unit, or a special thesis.
Example, how this reads on two well known districts
I’ll keep it light and not pretend we’ve scored every neighborhood on earth.
-
Business Bay tends to score high on liquidity and tenant depth because it sits in the flow of the city, and it shows up strongly in both value and volume in your January dataset.
-
Palm Jumeirah tends to score high on differentiation and premium demand, but selection becomes even more unit specific because price bands are wide and tenant profiles differ dramatically by building.
The point of including this is not to crown winners. It’s to show the reader you have a repeatable method, not a list of opinions.
Primary vs resale, investor comparison table
This is the table most investors screenshot and send to a friend. Make it clean.
| Question | Primary market | Resale market |
|---|---|---|
| Best for | Payment plan leverage, future appreciation, launch access | Immediate rental income, lower uncertainty, known building |
| Risk profile | Higher execution risk, timeline risk | Lower execution risk, more pricing negotiation |
| Cashflow timing | Later, after handover | Now, after transfer |
| Pricing behavior | Can include premium for newness and incentives | Can include discounts, motivated sellers |
| Liquidity | Strong when launches are hot, varies by project | Strong for proven buildings, varies by micro location |
| Ideal investor | Medium term, growth focused, flexible timeline | Yield focused, stability focused, clearer underwriting |
Sometimes the best move is a hybrid. Buy one off plan for upside, and one resale for cashflow, so you are not relying on a single outcome.
A practical investor checklist for January 2026 conditions
This is where you sound like a pro, without sounding salesy.
If you are buying primary
- Confirm developer delivery history, not just branding.
- Compare launch price to nearby ready stock, and ask what justifies the premium.
- Underwrite service charges, they can quietly destroy yields.
- Check handover concentration, how many units deliver in the same district in the same quarter.
- Ask for unit orientation, view corridor risk, and road noise risk, even in off plan.
- Have an exit plan, hold for rent, flip at handover, or sell earlier via assignment if allowed.
If you are buying resale
- Verify rentability, not just current rent, ask what a new tenant will pay today.
- Check building management quality, it affects tenant retention.
- Confirm DLD fees, agency fees, and time to transfer, so you know true all in cost.
- Compare three comps minimum, same line, same view class, similar floor.
- If you want short term rental potential, validate rules and realistic occupancy, not optimistic headlines.
For both markets
- Decide your objective first, cashflow, appreciation, or a balanced approach.
- Stay inside the liquidity band unless you have a strong reason not to, your data shows the broadest demand sits between AED 1M and 2M.
- Be honest about your timeline. A 24 month plan and a 72 month plan are different games.
DM me “JAN 2026” and I’ll send the top opportunities by budget.
A forward looking note, why the population and business inflows matter
Dubai passing 4 million residents is not just a flex, it translates into household formation, rental demand, and purchase demand over time. And large scale business and infrastructure commitments, like the expansion plans tied to Dubai International Financial Centre, reinforce the idea that demand is not purely speculative.
This does not mean prices go up forever. It means the baseline demand picture is structurally stronger than it was in the older boom cycles people like to reference.
Also, for credibility, you can attribute record month transaction reporting to Dubai Land Department coverage in Gulf News.
Answer box
January 2026 marked a record start to the year for Dubai real estate, with sales volume of 17,457 and sales value of AED 72.5B in the dataset provided, alongside YoY price growth and continued dominance of the primary market. Primary transactions represented about 69% of volume and 72% of value, suggesting buyer preference for new inventory and payment plans, while resale remained stable with steadier pricing and immediate cashflow potential. Demand clustered most heavily in the AED 1M to 2M band, indicating where liquidity is strongest. Top performing areas included Business Bay by both volume and value, while trophy deals in premium districts highlighted continued strength at the high end. Investors in 2026 benefit most from a selection led approach, focusing on unit quality, supply timing, tenant depth, and exit liquidity rather than relying on broad market appreciation.
Closing thought
January 2026 makes one thing obvious, Dubai is not relying on a single buyer type anymore. There’s high end activity, there’s mid market liquidity, there’s serious primary absorption, and resale still has a steady pulse.
But I think the biggest shift is psychological. The market feels less like a one story trade, and more like a city that is deepening. That can still come with pauses, it can still have overheated pockets, and some launches will absolutely be overpriced. Yet for investors who focus on selection, supply timing, and tenant demand, this is the kind of market where disciplined decisions tend to age well.
FAQs
1) Is Dubai real estate still a good investment in 2026?
For many buyers, yes, but it depends on what “good” means to you. January 2026 showed strong transaction momentum and pricing growth year on year, which supports the idea that demand is still deep. But the market also feels more selective now. In 2026, the difference between a great deal and an average one is usually not “Dubai vs not Dubai”, it’s the micro location, the building quality, service charges, and your exit plan. If your goal is stable cashflow, you should underwrite rent and costs carefully. If your goal is appreciation, you should focus on catalysts and scarcity, not just hype.
2) What is the average price per square foot in Dubai in January 2026?
Based on the dataset you provided, the overall market average is about AED 1,800 per square foot in January 2026. That is down about 0.6% month on month, but up about 15.6% year on year, which is a strong annual move even with a small monthly dip.
3) Are property prices in Dubai going up or cooling down in 2026?
Both things can be true at the same time. Year on year, prices are clearly up, your figures show double digit growth in price per square foot. Month on month, pricing is slightly softer, which can happen naturally after a strong run, especially when transaction mix changes. What matters more is that the market is not moving as one block. Some districts and unit types are still accelerating, while others are stabilizing. In 2026, price selection matters more than market direction headlines.
4) Is it better to buy off plan or resale in Dubai right now?
It depends on your timeline and risk comfort.
-
Off plan (primary) is usually better if you want payment plan leverage, access to new inventory, and potential upside into handover.
-
Resale (secondary) is usually better if you want immediate rental income, a known building and view, and less execution risk.
Your January split suggests primary is still leading in both volume and value, which often means developers are winning buyer attention through payment plans and new product. Resale still makes sense when the numbers work and you want cashflow now.
5) Which areas in Dubai had the highest sales volume in January 2026?
From your dataset, Business Bay led the month by volume with 686 transactions. Other high volume areas in your top list include Al Yelayiss 1 (628), Dubai Investment Park Second (390), and Hadaeq Sheikh Mohammed Bin Rashid (309). These clusters suggest a mix of apartment driven liquidity and villa or land driven activity.
6) Which areas in Dubai had the highest sales value in January 2026?
From your dataset, Business Bay also led by value with AED 2.9B, followed by Hadaeq Sheikh Mohammed Bin Rashid (AED 2.6B) and Al Yelayiss 1 (AED 2.1B). Value leaders often reflect a combination of higher ticket size, premium product, and occasional large land or villa transactions that swing totals.
7) What budget range has the most buyer demand in Dubai?
In your January 2026 distribution, the largest share of transactions sat in the AED 1M to 2M range at 29%. That range tends to be the market’s “liquidity core”, meaning it often has the broadest buyer pool. Under AED 1M was also significant at 24%, and the AED 2M to 3M band was 19%. Even the premium segment above AED 5M represented 14%, which shows the high end is still active.
8) What rental yields can investors expect in Dubai in 2026?
Yields vary a lot by area, building, and unit type, so it’s better to think in ranges rather than one number. In general, many investor focused apartment locations can target mid to high single digit gross yields, while prime luxury districts may run lower yields but stronger lifestyle demand and resale appeal. The important part in 2026 is net yield, after service charges, vacancy, maintenance, and leasing fees. If you share your target area and budget, I can estimate realistic rent and net yield based on the unit type and building profile.
9) How do Dubai mortgage trends affect property prices and buyer demand?
Mortgages matter because they shape the marginal buyer’s budget and resale liquidity. In your dataset, mortgage value is AED 13.5B, up 19.8% year on year, while the number of mortgage transactions fell to 2,703, down 33.5% year on year. That pattern often suggests fewer financed deals, but larger average loan sizes, or a bigger role for cash and developer payment plans. If financing becomes tighter, resale liquidity can slow first. If financing eases, demand can broaden quickly.
10) What are the main fees and costs when buying property in Dubai in 2026?
Costs vary depending on whether you buy off plan or resale, but buyers typically plan for:
- Dubai Land Department fees and registration related charges
- Agency fee in many resale transactions
- Developer admin fees in primary transactions
- Mortgage related fees if financing is used
- Service charges ongoing, which can materially impact net yield
- Conveyancing or legal support depending on how you structure the purchase
The most overlooked cost is usually service charges and the true all in transaction cost. Those two items can make a deal look great on paper and just average in real life.
*data provided by dxbinteract.com