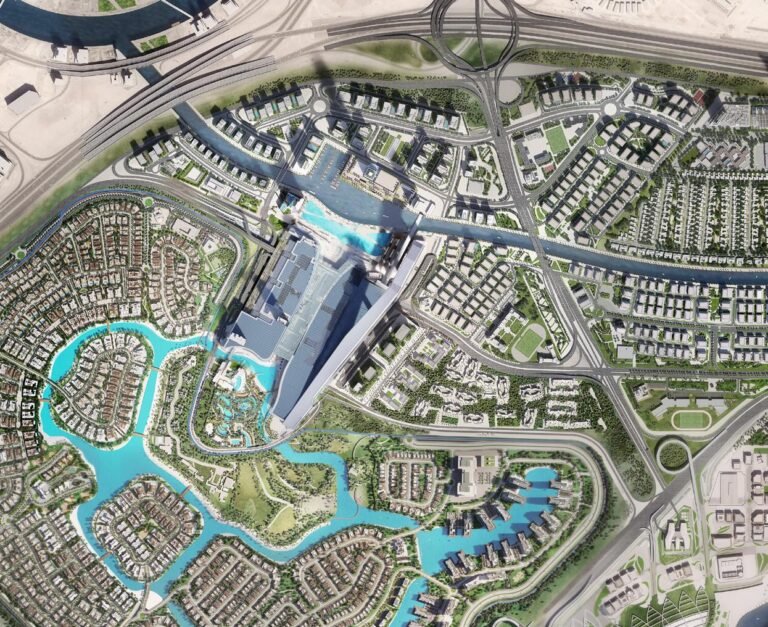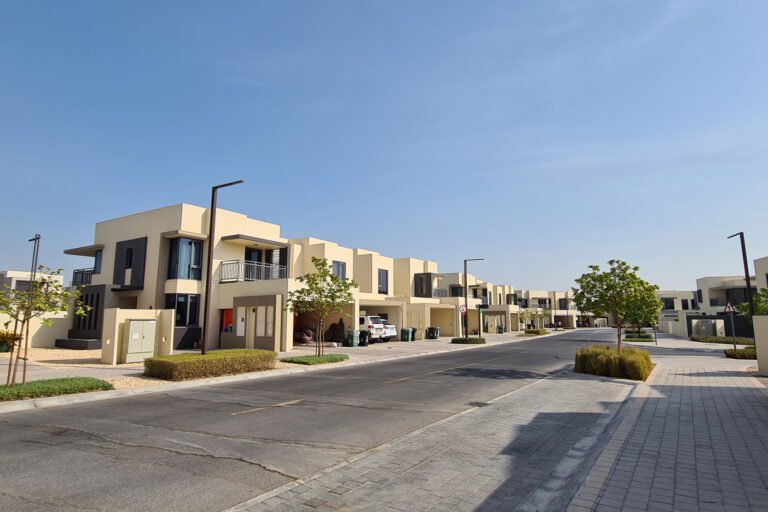


There are two prices on Al Marjan Island, and most arguments about the market come from people quoting one while thinking about the other. One is the market-wide apartment benchmark, which tracks older and non-branded stock. The other is new-launch branded beachfront off-plan, which prices far higher per sq ft. Both are real. Both exist on the same island at the same time. Once you separate them, the numbers stop contradicting each other.
At the top of the market, the Janu Residences launch starts around AED 8.5M.
Al Marjan Island Projects, the investor guide to what is actually happening, and what to watch next
Key takeaways
- Al Marjan is repricing, with +16.8% YoY apartment growth in Q3 2025 from ValuStrat-linked reporting.
- Off-plan runs the market: 84% of residential sales across the first nine months of 2025. That is why pricing feels story-driven.
- The Wynn timeline is concrete, not abstract. Spire planned in 2026, opening targeted Spring 2027.
- Underwrite short-term lets against observable data first. AirDNA shows about 42% occupancy and about $222 ADR in the Al Marjan dataset.
- Treat “very high net yields” as unit-specific and operator-specific. Baseline first, upside second.
Want the latest Al Marjan price per sq ft ranges by building and view? Send me what you are considering and I will map it to recent comps and current launch pricing.
Why people argue about the “average price”
Al Marjan real estate is moving fast through 2025 and 2026, and the Wynn resort is the reason. But the price headlines get messy. Someone quotes a single average that sounds precise, someone else calls it nonsense, and they are both right. That is the annoying part, and also the whole point.
The reason is simple. There are at least two pricing worlds here:
- Market-level valuation benchmarks that track the broader apartment market, including older and non-branded stock.
- New-launch, branded, beachfront off-plan pricing, which can be dramatically higher per sq ft.
Look only at branded launches and you can talk yourself into an “average” in the multiple thousands per sq ft. Look at valuation benchmarks and it sits closer to the low one thousands. Both are true at once. For context, ValuStrat reporting cited in Khaleej Times puts Al Marjan apartment prices at about AED 1,127 per sq ft in Q3 2025, with 16.8% year-on-year growth. That is not a brand-new branded tower asking rate.
So if you want a price and yield analysis that ranks units and also survives a skeptical investor reading it, separate these layers early and keep separating them.
Weighing Al Marjan against Dubai waterfront? I can run a side-by-side ROI comparison using your budget and holding timeline. Send me a message.
Market numbers at a glance (2025 to 2026)
| Metric | Best current public benchmark (what you can cite) | What it means in plain English |
|---|---|---|
| Apartment value growth on Al Marjan | +16.8% YoY in Q3 2025 | Strong appreciation, but not a straight line every quarter |
| Price anchor (apartments) | ~AED 1,127 per sq ft in Q3 2025 | A market benchmark, not a branded launch rate |
| Off-plan dominance (RAK freehold) | 84% of total residential sales in first nine months of 2025 | Off-plan is driving the volume and the psychology |
| Wynn timeline | Spire planned in 2026, opening planned Spring 2027 | A real catalyst, still a pipeline story today |
| STR snapshot (Al Marjan, AirDNA) | ~42% occupancy, ~$222 ADR | Useful for underwriting, highly unit-dependent |
A small note that matters. Some agency blogs quote apartment bands like AED 850 to AED 1,200 per sq ft in parts of RAK, broadly consistent with the benchmark view, but those are not always indexed or audited the same way. I use them for context, not as the main anchor.
Price analysis, 2025 to 2026 trends
1) Appreciation is real, but not uniform
The clean version: Al Marjan led RAK apartment growth in Q3 2025, up 16.8% year on year, and capital values rose quarter on quarter too. That is what happens when a place changes category, from regional leisure pocket to internationally marketed waterfront. Wynn drives that story, and so does RAK’s wider push into tourism.
Early 2026 reporting adds more. Al Marjan saw more than 21% price per sq ft growth in 2025 (Bayut data via Khaleej Times), which is why the island feels like it is moving quickly even to people who are not watching it every week.
2) A practical price per sq ft range
- Benchmark level (market-wide apartments): around AED 1,127 per sq ft (Q3 2025 index referenced publicly).
- Premium off-plan and branded beachfront: often materially higher, especially for branded towers with direct beach positioning, where asking rates move into multiple thousands per sq ft depending on brand, view, and payment plan.
That second line is deliberately not a single number. Lock it to “AED 2,500 to AED 4,000 per sq ft” as the island’s entry price and you are quietly mixing segments.
3) Off-plan dominance, and why it changes pricing behavior
ValuStrat’s reporting states that off-plan properties represented 84% of total residential sales across the first nine months of 2025, framing activity as developer-led demand.
When off-plan runs the market like that, pricing becomes story-driven. Not fake, just story-driven. Buyers are underwriting future scarcity, future tourism, future brand gravity. That can push premiums into the launch market while the broader benchmark catches up more slowly. So a premium tower can price like a mature resort island while parts of the resale market still feel like a normal waterfront community.
Want the premium vs benchmark breakdown for Al Marjan? I can show you which towers are priced for the story and which are still priced like a normal market. Send me a message with the word “Al Marjan”.
The Wynn effect
What we can say with confidence: Wynn Al Marjan reached a topping-out milestone, and Wynn’s own updates state the spire installation is planned for 2026, with a Spring 2027 opening target.
What I think is true: Wynn is pulling pricing forward. It compresses the time-to-premium narrative for nearby branded stock and lifts the island’s global awareness in a way normal residential marketing never manages.
Rental yield and ROI, long lets vs short stays
Most investors hit a moment with Al Marjan where the story splits. On one side, the Wynn catalyst pulling pricing forward before the island is mature. On the other, the boring part: rent, occupancy, operating costs, and whether a unit actually cashflows once it is handed over.
Define the terms first, because people mix them up
Gross yield is the simplest version:
Gross Yield = Annual Rent / Purchase Price
It ignores costs. Not wrong, just incomplete.
Net yield is what you actually care about if you are not trying to win an argument online:
Net Yield = Net Operating Income / Purchase Price
Net operating income means rent (or STR revenue) minus service charges, maintenance, letting fees, furnishing refresh, management, utilities for STR, and vacancy.
Reality check. When someone quotes “12.6% yield”, they might mean gross, they might mean net, and they might mean a best-case unit in a best-case month. So build a model that survives bad months too.
Long-term rentals, the steadier baseline
A clean, citeable benchmark: Al Hamra Village and Al Marjan Island offered steady rental yields between 5.5% and 5.8% based on Bayut data reported in Khaleej Times. Useful as a baseline, but connect it to actual rents.
Bayut’s 2025 Ras Al Khaimah market report states that apartments for rent on Al Marjan Island saw rental prices rise by about 8% to 11%, with studios around AED 39k, 1-beds around AED 59k, and 2-beds around AED 90k.
Here is where it gets slightly confusing. Combine “AED 59k rent” with a “high purchase price” and the yield can drop below the 5.5% to 5.8% range. That does not mean the benchmark is wrong. It usually means one of these:
- the purchase price you are assuming is too high for the unit you are renting long term
- the rent you are assuming is too low for a furnished waterfront unit, or a smaller unit with stronger rent-per-dirham dynamics
- the yield figure is for a different slice of inventory, different timing, or a different calculation method
Rather than pretend the market is one clean line, I publish the cost and yield stack explicitly.
Long-let cost stack (typical items to budget)
| Cost item | Why it matters | How it usually behaves |
|---|---|---|
| Service charges | The silent yield killer in waterfront buildings | Usually fixed per year, tied to building facilities |
| Maintenance reserve | AC, appliances, paint, small repairs | Lumpy, not monthly, plan a reserve anyway |
| Leasing and renewal fees | Tenant acquisition, renewals | Recurring, varies by operator |
| Vacancy allowance | Time between tenants | Even a good unit is not 12 months occupied forever |
A long-term lease is not set-and-forget, but it is close. It is also the model that holds up best when the market gets noisy.
Short-term rentals, what the 2025 to 2026 snapshot suggests
Here is a dataset we can point to without hand-waving. AirDNA’s Al Marjan overview shows about 42% occupancy, about $189.8 ADR, and 161 active listings in the dataset. Three numbers, enough for a first-pass revenue estimate.
A simple STR revenue estimate (using the AirDNA snapshot)
- ADR: $189.8
- Occupancy: 42%
- Nights sold per year: 365 x 0.42 = about 153 nights
- Gross revenue: 153 x 189.8 = about $29,000 per year (ballpark)
Convert to AED at the pegged rate and you land near AED 100k to 110k gross. That sounds good until you price the unit, and then the yield looks like a normal yield again. Not bad. Just not magic.
Why STR yields can look high and still disappoint
STR carries a second set of costs long lets do not:
| STR cost item | What it includes |
|---|---|
| Management | Guest comms, pricing, channel ops |
| Turnover | Cleaning, linens, consumables |
| Utilities and internet | Usually owner-paid |
| Wear and tear | Furniture refresh, small breakage, more frequent |
This is why publishing a confident single “net STR yield” backfires. It depends on the operator, the furnishing level, and how seasonal demand turns out to be on your specific micro-location.
Price anchors for Al Marjan in 2025 to 2026
The AED 2,546 per sq ft figure is supported by dubizzle’s Ras Al Khaimah annual market report for 2025, which states Al Marjan apartment per-square-foot price increased to AED 2,546 in 2025. Bayut’s analysis puts pricing by bedroom type around:
- 1-bed: AED 2,381 per sq ft
- 2-bed: AED 2,447 per sq ft
- 3-bed: AED 2,586 per sq ft
So a defensible way to phrase pricing:
- Mainstream transaction and portal benchmarks cluster around the mid AED 2,000s per sq ft in 2025.
- Premium branded beachfront stock can price higher, and can distort “average” discussions.
A practical yield bridge, what STR needs to do to beat long lets
Instead of promising a 12% net yield, I prefer a small sensitivity table. It is more honest, and it helps readers self-select.
STR sensitivity (illustrative, using AirDNA-style inputs)
Assume a unit where the STR can achieve:
| Occupancy | ADR ($) | Approx annual gross revenue ($) | What it implies |
|---|---|---|---|
| 35% | 175 | ~22,000 | Soft demand or weaker positioning |
| 42% | 190 | ~29,000 | Close to AirDNA snapshot baseline |
| 55% | 230 | ~46,000 | Strong operator, strong seasonality capture |
If your purchase price is high, the only way STR produces headline yields is if ADR and occupancy climb together while costs do not climb at the same pace. Sometimes they do. Sometimes they do not. That is the risk and the opportunity.
Al Marjan vs Dubai waterfront, a quick benchmark comparison
A lot of investors compare Al Marjan to Dubai Marina because it is a familiar waterfront reference, and because it is liquid. Dubizzle’s Dubai 2025 sales report states that in Dubai Marina, the average price per sq ft for apartments rose to AED 2,190, and the area delivered about 5.73% ROI (their wording). Compare that to Al Marjan’s published benchmark of AED 2,546 per sq ft in 2025.
Comparison table (using published portal benchmarks)
| Market | Price per sq ft (benchmark) | Yield / ROI (published) | Takeaway |
|---|---|---|---|
| Al Marjan Island | ~AED 2,546 (2025) | 5.5% to 5.8% yields (Bayut data via Khaleej Times) | Pricing is no longer cheap, the bet is future maturity and tourism gravity |
| Dubai Marina | ~AED 2,190 (2025) | ~5.73% ROI (dubizzle) | Mature, liquid, often easier to underwrite, less new-catalyst upside |
This is the moment you pause and notice Al Marjan is pricing close to Dubai Marina per sq ft. It feels counterintuitive. It also explains why the narrative matters so much. You are not buying cheap RAK. You are buying a future resort island positioning.
Where off-plan dominance changes the ROI conversation
ValuStrat’s Q3 2025 reporting states that off-plan properties represented 84% of total residential sales across the first nine months of 2025. When off-plan dominates like that, yield is often a second-order decision. Investors are buying delivery timing, payment-plan leverage, and future repricing, not just year-one cashflow.
Wynn timeline, what matters and what is just noise
Factual first. Wynn Al Marjan’s tower hit its highest structural concrete point at 70 floors, and Wynn’s own update states the spire installation is planned for 2026. Once the spire is up, the building reaches its full architectural height of 352 meters, and Wynn targets a Spring 2027 opening.
That matters for pricing because markets do not wait for ribbon-cutting. They price milestones in waves.
A simple catalyst ladder (how repricing often happens)
| Catalyst stage | What buyers start to believe | Typical market behavior |
|---|---|---|
| Announcement and planning | “This place is about to be re-rated” | Premiums begin, mostly in off-plan |
| Visible construction milestones | “It’s real, and it’s on track” | Broader demand expands beyond early adopters |
| Infrastructure delivery (roads, bridges, services) | “Access improves, hassle drops” | End-user demand and STR demand improve |
| Opening window | “Tourism volume becomes measurable” | Rent and ADR trends become easier to underwrite |
Right now Al Marjan is in the late-milestone phase. The project is real, the timeline is tangible, but the island is still finishing its resort-ecosystem feel. That gap is where the opportunity sits, and also where the mistakes happen.
The 2025 to 2026 price narrative
A lot of blogs want one number. Real markets give you two.
- ValuStrat-linked reporting cited by Khaleej Times shows Al Marjan apartment prices up 16.8% YoY in Q3 2025, and +6.3% quarter-on-quarter in capital values, which supports the repricing thesis.
- Khaleej Times also reports Al Marjan prices rose by more than 21% in 2025 (Bayut data, reported Jan 2026).
At the same time, the wider RAK context matters. ValuStrat’s update notes 84% of residential sales were off-plan across the first nine months of 2025, and gross rental yields averaged 5.4%. Those two lines tell you what kind of market this is. Developer-led and future-facing, but yields still have to land somewhere rational for the investment to hold up.
A practical underwriting model, your ROI sanity check
This is what I would want in front of me before buying a unit, especially one priced as future premium.
Step 1: Pick your strategy bucket
| Strategy | Who it fits | What you are betting on |
|---|---|---|
| Long let, unfurnished or lightly furnished | Conservative investors, stable cashflow | Tenant demand and steady yields |
| STR, professionally managed | Hands-off but return-focused | Tourism volume, ADR, and operations |
| Off-plan, exit or refinance at handover | Growth focused | Repricing between launch and handover |
| Hybrid, long let most of the year, STR seasonally | Optimizers | Capturing peaks without full STR complexity |
Step 2: Revenue reality check (STR)
AirDNA’s Al Marjan snapshot shows ~42% occupancy, ~$222 ADR, and a dataset of 161 properties, with monthly revenue figures in the same view. That gives you a baseline. Your unit can beat it or underperform it, but you stop guessing wildly.
A rule I use: if your underwriting needs both high ADR and high occupancy to work, it is fragile. If it works at baseline and improves with good management, it is stronger.
Step 3: Cost stack, where net yield lives or dies
Long-let costs tend to be simpler. STR costs add turnover and utilities, plus higher wear. For a clean shortcut on STR net math, use a conservative operating ratio first, then refine:
- STR net = STR gross revenue x (1 – operating ratio)
- Most operators land in a broad band depending on service level, furnishing, and how often the unit turns. Start conservative, then negotiate.
That sounds vague. It is. But it is safer than publishing a fake-precise net yield that collapses the moment a building’s service charges come in.
Al Marjan vs other markets, and why it is not just about price
The more useful comparison is not “is it cheaper than Dubai”.
Comparison table (decision factors)
| Factor | Al Marjan Island (2025 to 2026) | Mature Dubai waterfronts (general) |
|---|---|---|
| Market phase | Re-rating, catalyst-driven | Mature, liquidity-driven |
| Supply shape | Off-plan heavy, new launches dominate | More balanced resale market |
| Demand driver | Tourism pipeline plus new resort ecosystem | Established resident and tourism base |
| Underwriting difficulty | Higher, more assumptions | Lower, more historical data |
| Upside style | Narrative plus delivery milestones | Mostly yield plus modest growth |
You can make money in either. It is just different work.
Risks and watchpoints, the honest section
Risk map
| Risk | What it looks like | What to do about it |
|---|---|---|
| Delivery risk | Handover slips, finishing quality variance | Buy from stronger execution, inspect clauses |
| Price volatility | Fast growth cools, resale spreads widen | Underwrite a long-term hold, avoid forced exits |
| STR seasonality | Occupancy swings, rates soften off-peak | Choose a unit type with broad demand, studios and 1BR often help |
| Service charge surprise | Net yield gets clipped | Ask for service charge ranges early, do not assume |
| Overpaying for the story | Paying tomorrow’s price today | Compare against baseline performance, not the brochure |
One mild contradiction I will admit: I like catalyst markets, but I hate paying peak premiums. So I end up saying the same thing again and again. Focus on the micro. The stack, the view, the layout, the operator, the building’s rules for holiday homes. That is where returns get protected.
FAQs
What is the current price per sq ft on Al Marjan Island in 2025 to 2026?
It depends on whether you mean market-wide benchmarks or branded new-launch asking rates. ValuStrat-linked reporting shows strong growth, including +16.8% YoY in Q3 2025, while premium beachfront products can price materially higher depending on brand, view, and payment plan.
Are rental yields on Al Marjan Island actually high?
At the market level, ValuStrat’s update notes gross rental yields averaged 5.4% in Ras Al Khaimah in Q3 2025. Short-stay performance can beat long lets for well-positioned units, but net yield depends heavily on service charges, turnover costs, and the operator.
How much does Wynn affect Al Marjan property prices?
Wynn is the main global attention catalyst. Its own updates confirm major construction milestones, with the spire planned in 2026 and opening targeted Spring 2027, which pulls buyer demand forward before the resort opens.
Is Al Marjan mostly off-plan or resale?
Off-plan dominates the cycle right now. ValuStrat reports 84% of residential sales were off-plan across the first nine months of 2025, which is why launch pricing and payment plans shape expectations.
What is the simplest way to underwrite an STR on Al Marjan?
Start with observed market stats, then stress-test. AirDNA shows roughly 42% occupancy and $222 ADR in its Al Marjan dataset. Apply a conservative cost ratio before you call anything “net yield”.
If you are after coastal ROI and can wait out two or three development phases, Al Marjan is one of the most data-supported entry points in the GCC waterfront market right now.