Новинка
3 дек. 2025 г.
Market Reports

To buy property in Dubai, you still need the basics: a valid passport, proof of funds, and, if you already live here, an Emirates ID and clean compliance checks. But honestly, in late 2025, paperwork is not the hard part. The hard part is understanding what you are buying into.
Because the Dubai real estate market in November 2025 was not just “strong”. It was loud.
Record off-plan momentum, a surge in apartment and villa prices, and rental growth that made a lot of landlords quietly smile and a lot of tenants… well, reconsider their budgets.
According to Land Department data aggregated by independent analysts, November 2025 recorded 19,019 sales transactions, up about 30% versus November 2024, with a total sales value of roughly AED 64.7 billion, almost 50% higher year-on-year. Average prices per square foot and median ticket sizes moved higher across almost every major segment. Apartments around AED 1.4M on average, villas closer to AED 4.1M – and that is just the mid-point, not the shiny top of the market.
At the same time, we are not in the same phase as 2022–2023. Back then, monthly price growth comfortably sat above 1% for months on end. By November 2024, the market was already showing moderation, with prices rising a more modest 0.48% month-on-month and averaging about AED 1,480 per sq ft according to the Property Monitor Dynamic Price Index. November 2025 builds on that plateau: volumes explode, values climb, but the underlying cycle is more mature.
So, this overview is written for someone who wants to see the full picture – not just a headline that says “record month again”. I will walk through the residential sales market, rental dynamics, off-plan vs resale split, commercial real estate, and finally what all this might mean if you are thinking about buying, selling, or restructuring your Dubai portfolio right now.
Along the way, I will reference real areas and projects you actually see in the market – from JVC and Business Bay to Palm Jumeirah, Bay Villas – Dubai Islands, and Binghatti Flare – so the numbers do not float in the air.
Quick snapshot: What happened in November 2025?
Let us start with a bird’s-eye view before diving into micro-segments. You can think of November 2025 as a month where transaction velocity and capital inflows did most of the talking.
Market snapshot – November 2025 vs November 2024
Segment | Sales volume (transactions) | YoY change vs Nov 2024 | Avg price per sq ft (AED) | YoY change | Total sales value (AED bn) | YoY change |
|---|---|---|---|---|---|---|
All properties | 19,019 | +30.9% | 1,755 | +16.1% | 64.7 | +49.6% |
Off-plan (1st sale) | 13,374 | +50.6% | 1,835 | +16.6% | 41.4 | +65.3% |
Resale (approx.) | ~5,600 | c. +5–8% (est.) | n/a (varies by area) | n/a | ~23.3 | c. +25–30% |
Note: Resale volumes and values are derived from the stated 70% / 30% volume split and 64% / 36% value split between first sale and resale transactions.
A few things jump out immediately:
Off-plan dominates: Roughly 70% of all transactions were first-sale deals (mainly off-plan), with resale making up about 30% of the volume. In value terms, first sale still leads with 64% of the total.
Value grows faster than volume: Transactions are up around 30%, but total dirham value is up almost 50%, which means buyers are gravitating to bigger, more expensive, or more premium-located assets.
Price per sq ft keeps grinding higher: The move from roughly AED 1,480 per sq ft in November 2024 to around AED 1,755 in November 2025 represents a strong double-digit annual increase – on top of several years of growth.
If you zoom out further, these numbers sit on top of a multi-year rally. Since early 2021, residential prices in Dubai have risen by 60–75% depending on the index and segment. Fitch and other rating agencies are already warning about a possible double-digit correction in the later part of 2025–2026 if supply continues at record pace. So, we are talking about a hot, but also increasingly complex, market.
Residential market: volume records and a quiet shift in mix
In November 2025, the residential market – apartments plus villas and townhouses – was the core engine behind those 19,019 transactions. Commercial, plots, and buildings all played a part, but if you are an investor asking “Where is the real liquidity?”, the answer is still firmly: residential units.
From a very practical investor’s point of view, three themes stand out:
Record-level demand for primary (off-plan) units.
Strong price growth in villas, with apartments still doing the heavy lifting on volume.
Rental pressure translating into very healthy yields in many “middle-market” communities.
Let us unpack that.
Apartments: liquidity in Business Bay, Downtown, and JVC
Apartments remain the workhorse of the market. In November 2025:
Average apartment sale prices hovered around AED 1.4M, a +14% rise versus November 2024.
Average apartment rents reached roughly AED 75,000 per year, up 11.9% YoY, tightening yields further in favour of landlords.
Market-wide, apartment sales volumes grew by around 14%, with Business Bay, Downtown Dubai, and JVC absorbing a large share of the demand.
When I look at these numbers, I do not just see “price growth”. I see something slightly subtler: buyers are clustering around well-connected, high-amenity, mixed-use zones that still feel “central” but offer very different price points.
Business Bay anchors the “urban professional / mixed-use” story: lots of one-bed, two-bed units, strong corporate and short-stay demand.
Downtown is the trophy postcard – with higher ticket sizes, limited new supply, and global branding anchored by Burj Khalifa and Dubai Mall.
JVC (Jumeirah Village Circle) is the volume champion: 1,426 transactions in November alone, thanks to its relative affordability and steady rental demand.
Best-selling first-sale apartment projects (November 2025)
To make it a bit more concrete, here are the top 1st sale (off-plan) apartment projects by volume that month, based on the data you provided:
# | Project | Volume (units) | Value (AED) | Median price (AED) |
|---|---|---|---|---|
1 | Binghatti Flare | 369 | 470.7M | 1.3M |
2 | Damac Riverside (All Buildings) | 229 | 306.1M | 1.2M |
3 | Sobha Solis | 205 | 261.1M | 1.1M |
4 | Chelsea Residences by Damac | 108 | 313.3M | 2.5M |
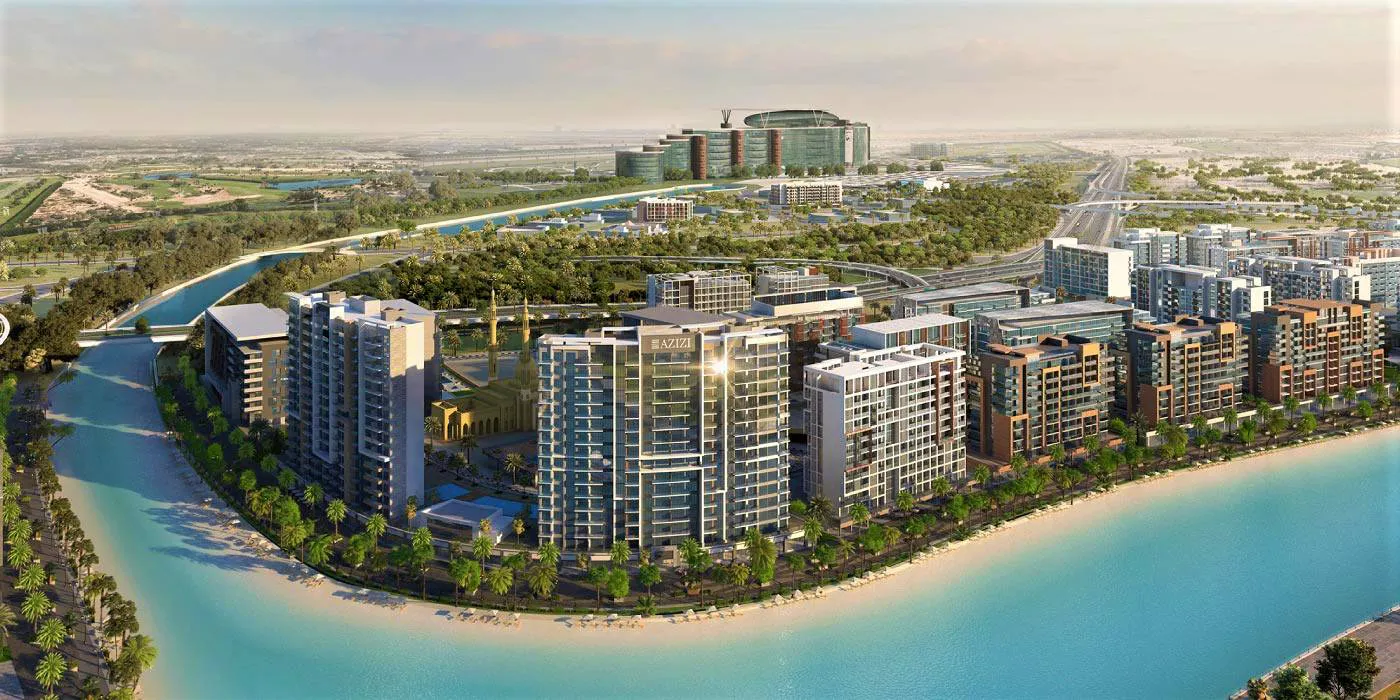
5 | Azizi Mirage 1 | 106 | 61.2M | 505K |
You can almost see the strategy mix here:
Sub-1.5M units in Riverside, Solis, and Binghatti Flare cater to yield-hungry investors who want strong liquidity and a manageable ticket size.
Higher-ticket, more boutique projects like Chelsea Residences target buyers who are more sensitive to branding, finishes, and lifestyle than to absolute yield.
For readers who want to pair this overview with deeper project-level due diligence, you can explore our guide to luxury branded residences in Dubai, including W Residences and similar flagship projects, on the Totality blog:
👉 Best Luxury Branded Residences in Dubai
Villas: 30.7% price growth and a land scarcity story
Villas are where the numbers start to look a little dramatic. In November 2025:
Average villa sale prices reached about AED 4.1M, up 30.7% YoY.
Average villa rents climbed to roughly AED 188.9K per year, a 7.5% increase versus November 2024.
Why such an outsized jump on the sales side? Three reasons come up again and again in both the data and on-the-ground conversations:
Scarcity of land in prime villa zones – you cannot simply “add more Palm Jumeirah” or quickly replicate established family communities.
Post-pandemic lifestyle shifts – families still value space, private gardens, and home offices, even as offices have largely reopened.
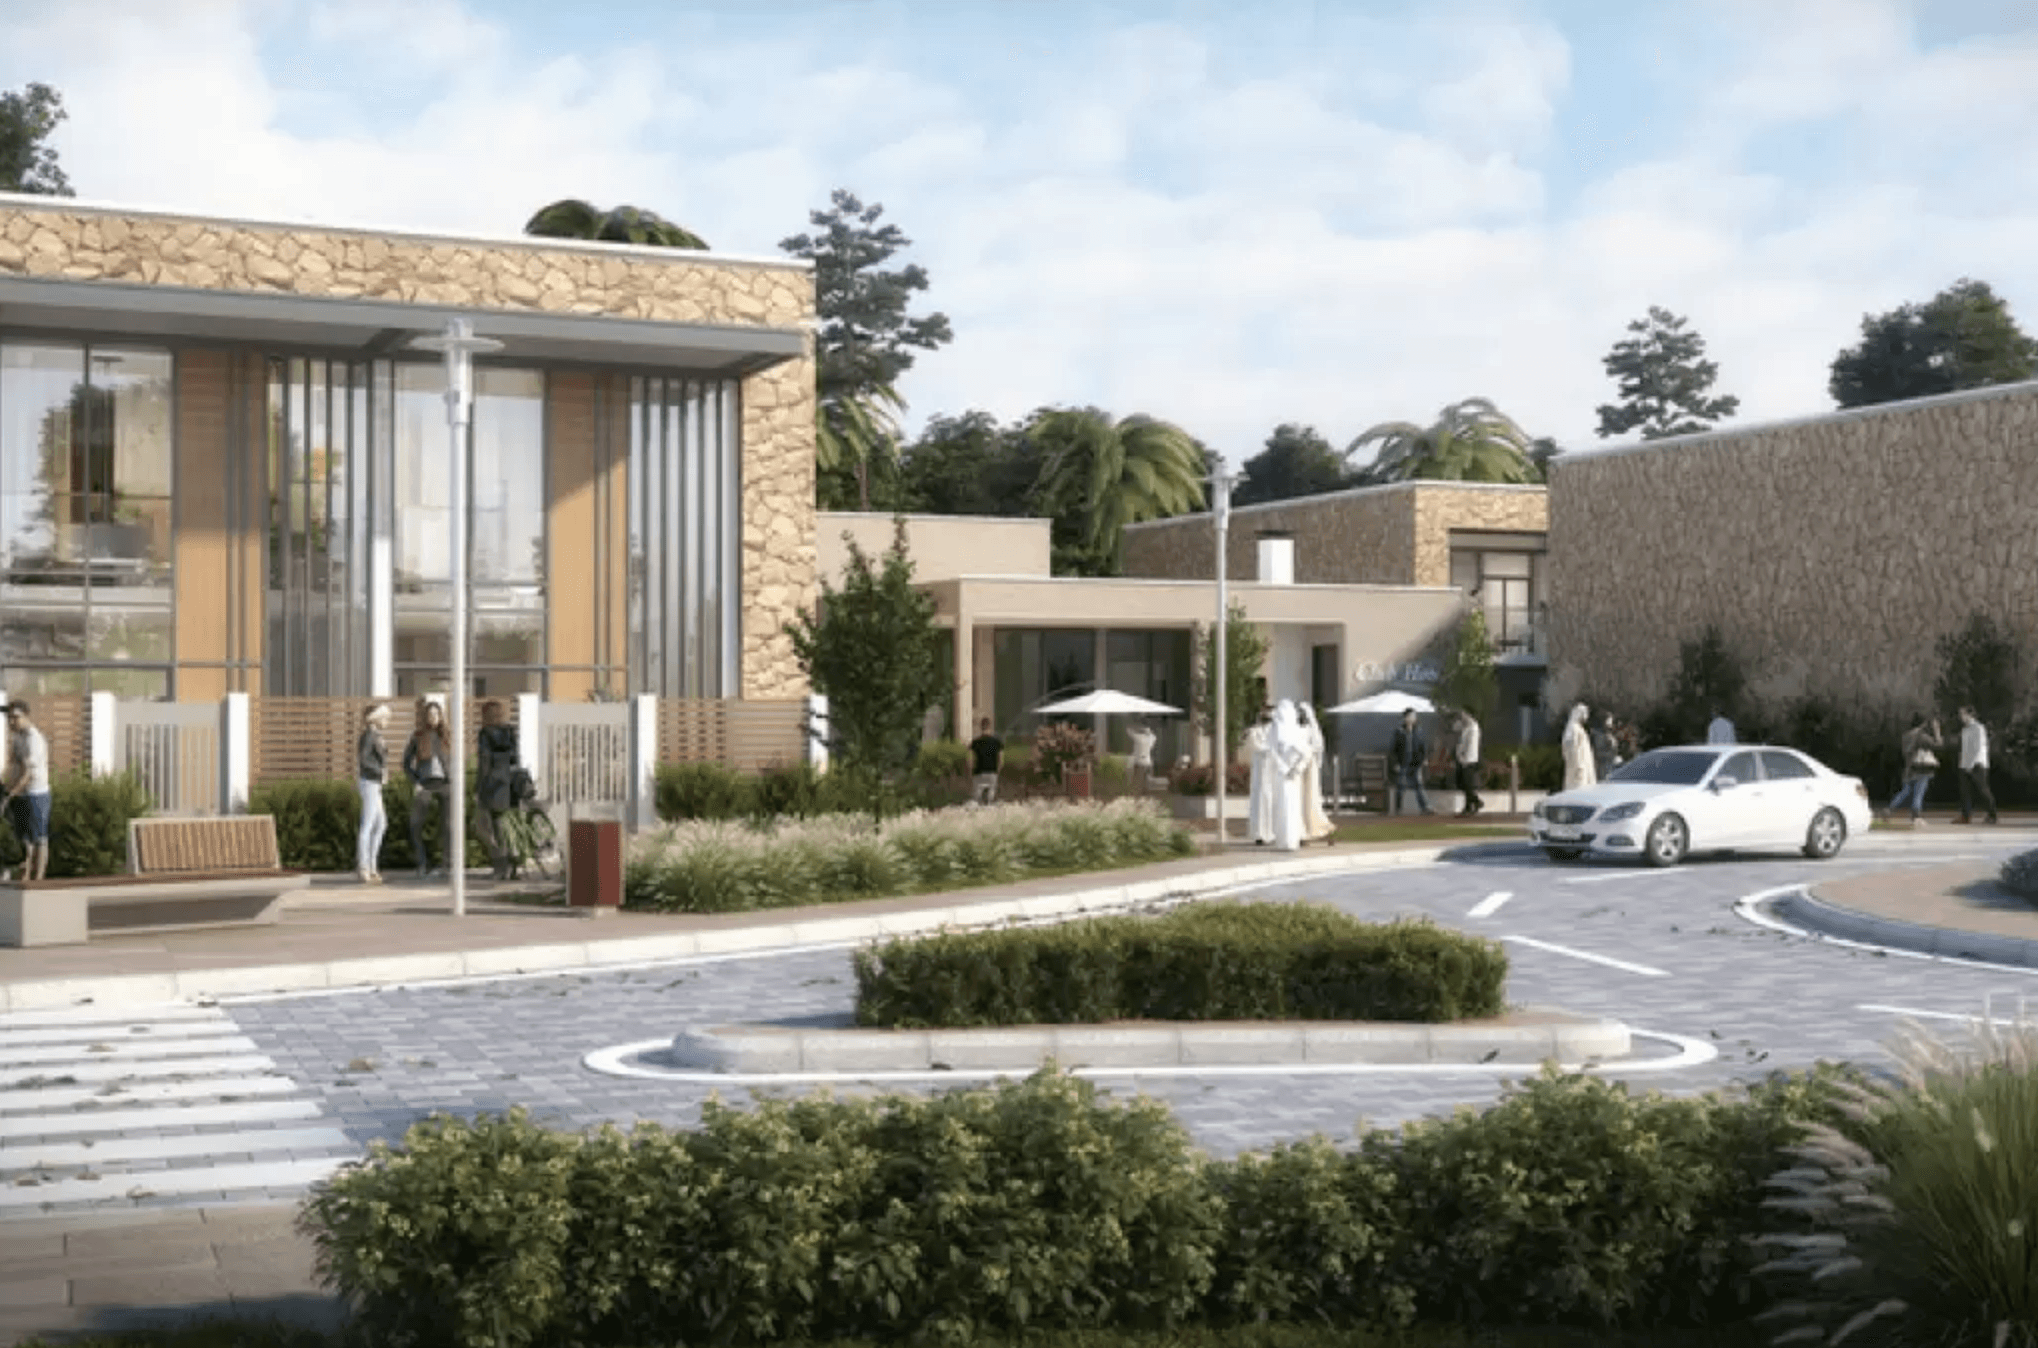
Developer upgrades – new villa communities are typically better designed than older stock: wider roads, integrated retail, more schools nearby, more structured community amenities.
Best-selling first-sale villa projects (November 2025)
# | Project | Volume (units) | Value (AED) | Median price (AED) |
|---|---|---|---|---|
1 | Grand Polo – Selvara 2 | 66 | 438.9M | 6.6M |
2 | Dubai Investment Park Second | 62 | 186.4M | 2.8M |
3 | Nad Al Sheba First | 56 | 704.1M | 13.9M |
4 | Bay Villas – Dubai Islands | 34 | 335.0M | 7.1M |
5 | Reportage Village 1 | 28 | 36.9M | 1.4M |
Here, you can see the barbell:
On one end, ultra-premium enclaves like Nad Al Sheba First and Bay Villas – Dubai Islands, with high median prices and strong long-term capital appreciation potential.
On the other, more accessible projects like Dubai Investment Park Second and Reportage Village 1, which keep tickets reasonable but still give exposure to villa-style living.
If your goal is to build a cash-flow-focused villa portfolio, the sweet spot often sits in that mid-range – around AED 2.5M–4.5M – where financing is still manageable and rental demand from upper-middle-income families is deep. That is precisely the type of analysis we do daily at Totality Real Estate, combining yield modelling with area-by-area data.
Rental market: rising costs, resilient yields
If you talk to tenants in Dubai right now, the first word you will probably hear is “rents”. Not “views” or “amenities”. Just rents.
In November 2025, the rental market continued the pattern we have been seeing since 2022:
Average apartment rent: ~AED 75,000/year, +11.9% vs November 2024
Average villa rent: ~AED 188,900/year, +7.5% vs November 2024
Average commercial rent: ~AED 90,000/year, a sharp +78.2% YoY jump, albeit from a lower base in some fringe office and retail segments
Here is a simple snapshot:
Segment | Average annual rent (AED) | YoY change vs Nov 2024 |
|---|---|---|
Apartments | 75,000 | +11.9% |
Villas | 188,900 | +7.5% |
Commercial | 90,000 | +78.2% |
Now, if we roughly overlay these rents with the average sale prices you saw earlier:
Apartments at around AED 1.4M
Villas at around AED 4.1M
Commercial units at around AED 2.1M
…you end up with headline gross yields of roughly:
Apartments: ~5.3–5.7%
Villas: ~4.5–4.8%
Commercial: can stretch higher, but variance is huge (prime vs secondary; fitted vs shell-and-core).
Of course, this is just the 10,000-foot view. In reality, you see big differences:
A compact, well-designed one-bed in JVC or Dubai South may reach 7–8% gross yield.
A large three-bed on the Palm might sit at 4–4.5%, but with stronger long-term capital preservation.
Some branded residences in Business Bay and Downtown trade at yields that look low on paper, yet buyers accept it because they are paying for branding, exclusivity, and long-term positioning rather than short-term cash flow.
This is where a lot of investors, especially first-timers, underestimate Dubai. It is not just a “high-yield paradise.” It can be – in selected pockets, with the right management model – but yield is increasingly something you build through careful selection, not something the market gives you by default.
If you want a deeper dive on how yields behave across communities, you might find it useful to pair this article with a broader rental yields guide on our main site:
👉 Visit Totality Real Estate for detailed, data-led breakdowns and bespoke yield modelling.
Off-plan vs resale: what a 70/30 split really tells you
One of the biggest structural features of the November 2025 data is the dominance of first-sale (off-plan) transactions.
70% of all transactions were 1st sale (mostly off-plan or newly handed-over stock).
30% were resale.
In value terms, roughly 64% of dirhams went into 1st sale, 36% into resale.
Why is off-plan so dominant?
Some reasons are obvious:
Developers are launching aggressively – over 17,700 units released in a single month is extraordinary by any historical standard.
Payment plans remain flexible in many projects (structured 60/40, 70/30, or post-handover), which makes the entry ticket psychologically easier.
Global investors, especially from Europe, the UK, Russia/CIS, and increasingly North America, tend to see Dubai off-plan as a way to “ride the story” without deploying all capital on day one.
But there is also a subtler, slightly more uncomfortable angle:
A heavy off-plan skew usually signals that a significant part of the demand is speculative or forward-looking, not purely end-user driven.
It relies on the assumption that upon completion, there will be either:
an end-user willing to absorb the unit at a higher all-in price, or
another investor willing to pay for the “finished product” plus your margin.
Neither of these is inherently bad. Dubai has been functioning on that model, in cycles, for almost two decades. But it does mean that if you are building a portfolio today, you should be honest with yourself about where exactly your return is supposed to come from:
Entry discount vs future value?
Capital appreciation vs rental cash flow?
Launch pricing vs expected handover pricing?
A more balanced strategy – this is just my view after seeing too many one-dimensional portfolios – often involves a blend of:
1–2 off-plan projects with strong fundamentals (location, developer, realistic handover dates), and
1–2 ready or nearly ready units in communities with proven rental demand.
That way, your overall position does not entirely depend on one exit window three or four years out. It might sound conservative, but conservative is not always the enemy of returns.
If you want a structured framework for combining off-plan and resale in a way that fits your risk profile, that is exactly the kind of work we do in our strategy sessions at Totality Real Estate.
Top performing areas: value vs volume
The Dubai market is not one single organism. It is a cluster of micro-markets that just happen to share the same skyline. November 2025 made this extremely clear if you look at where the money actually flowed.
By total value (AED)
Top five areas by total sales value in November 2025:
Rank | Area | Sales value (AED bn) | Transactions |
|---|---|---|---|
1 | Umm Suqeim First | 3.9 | 29 |
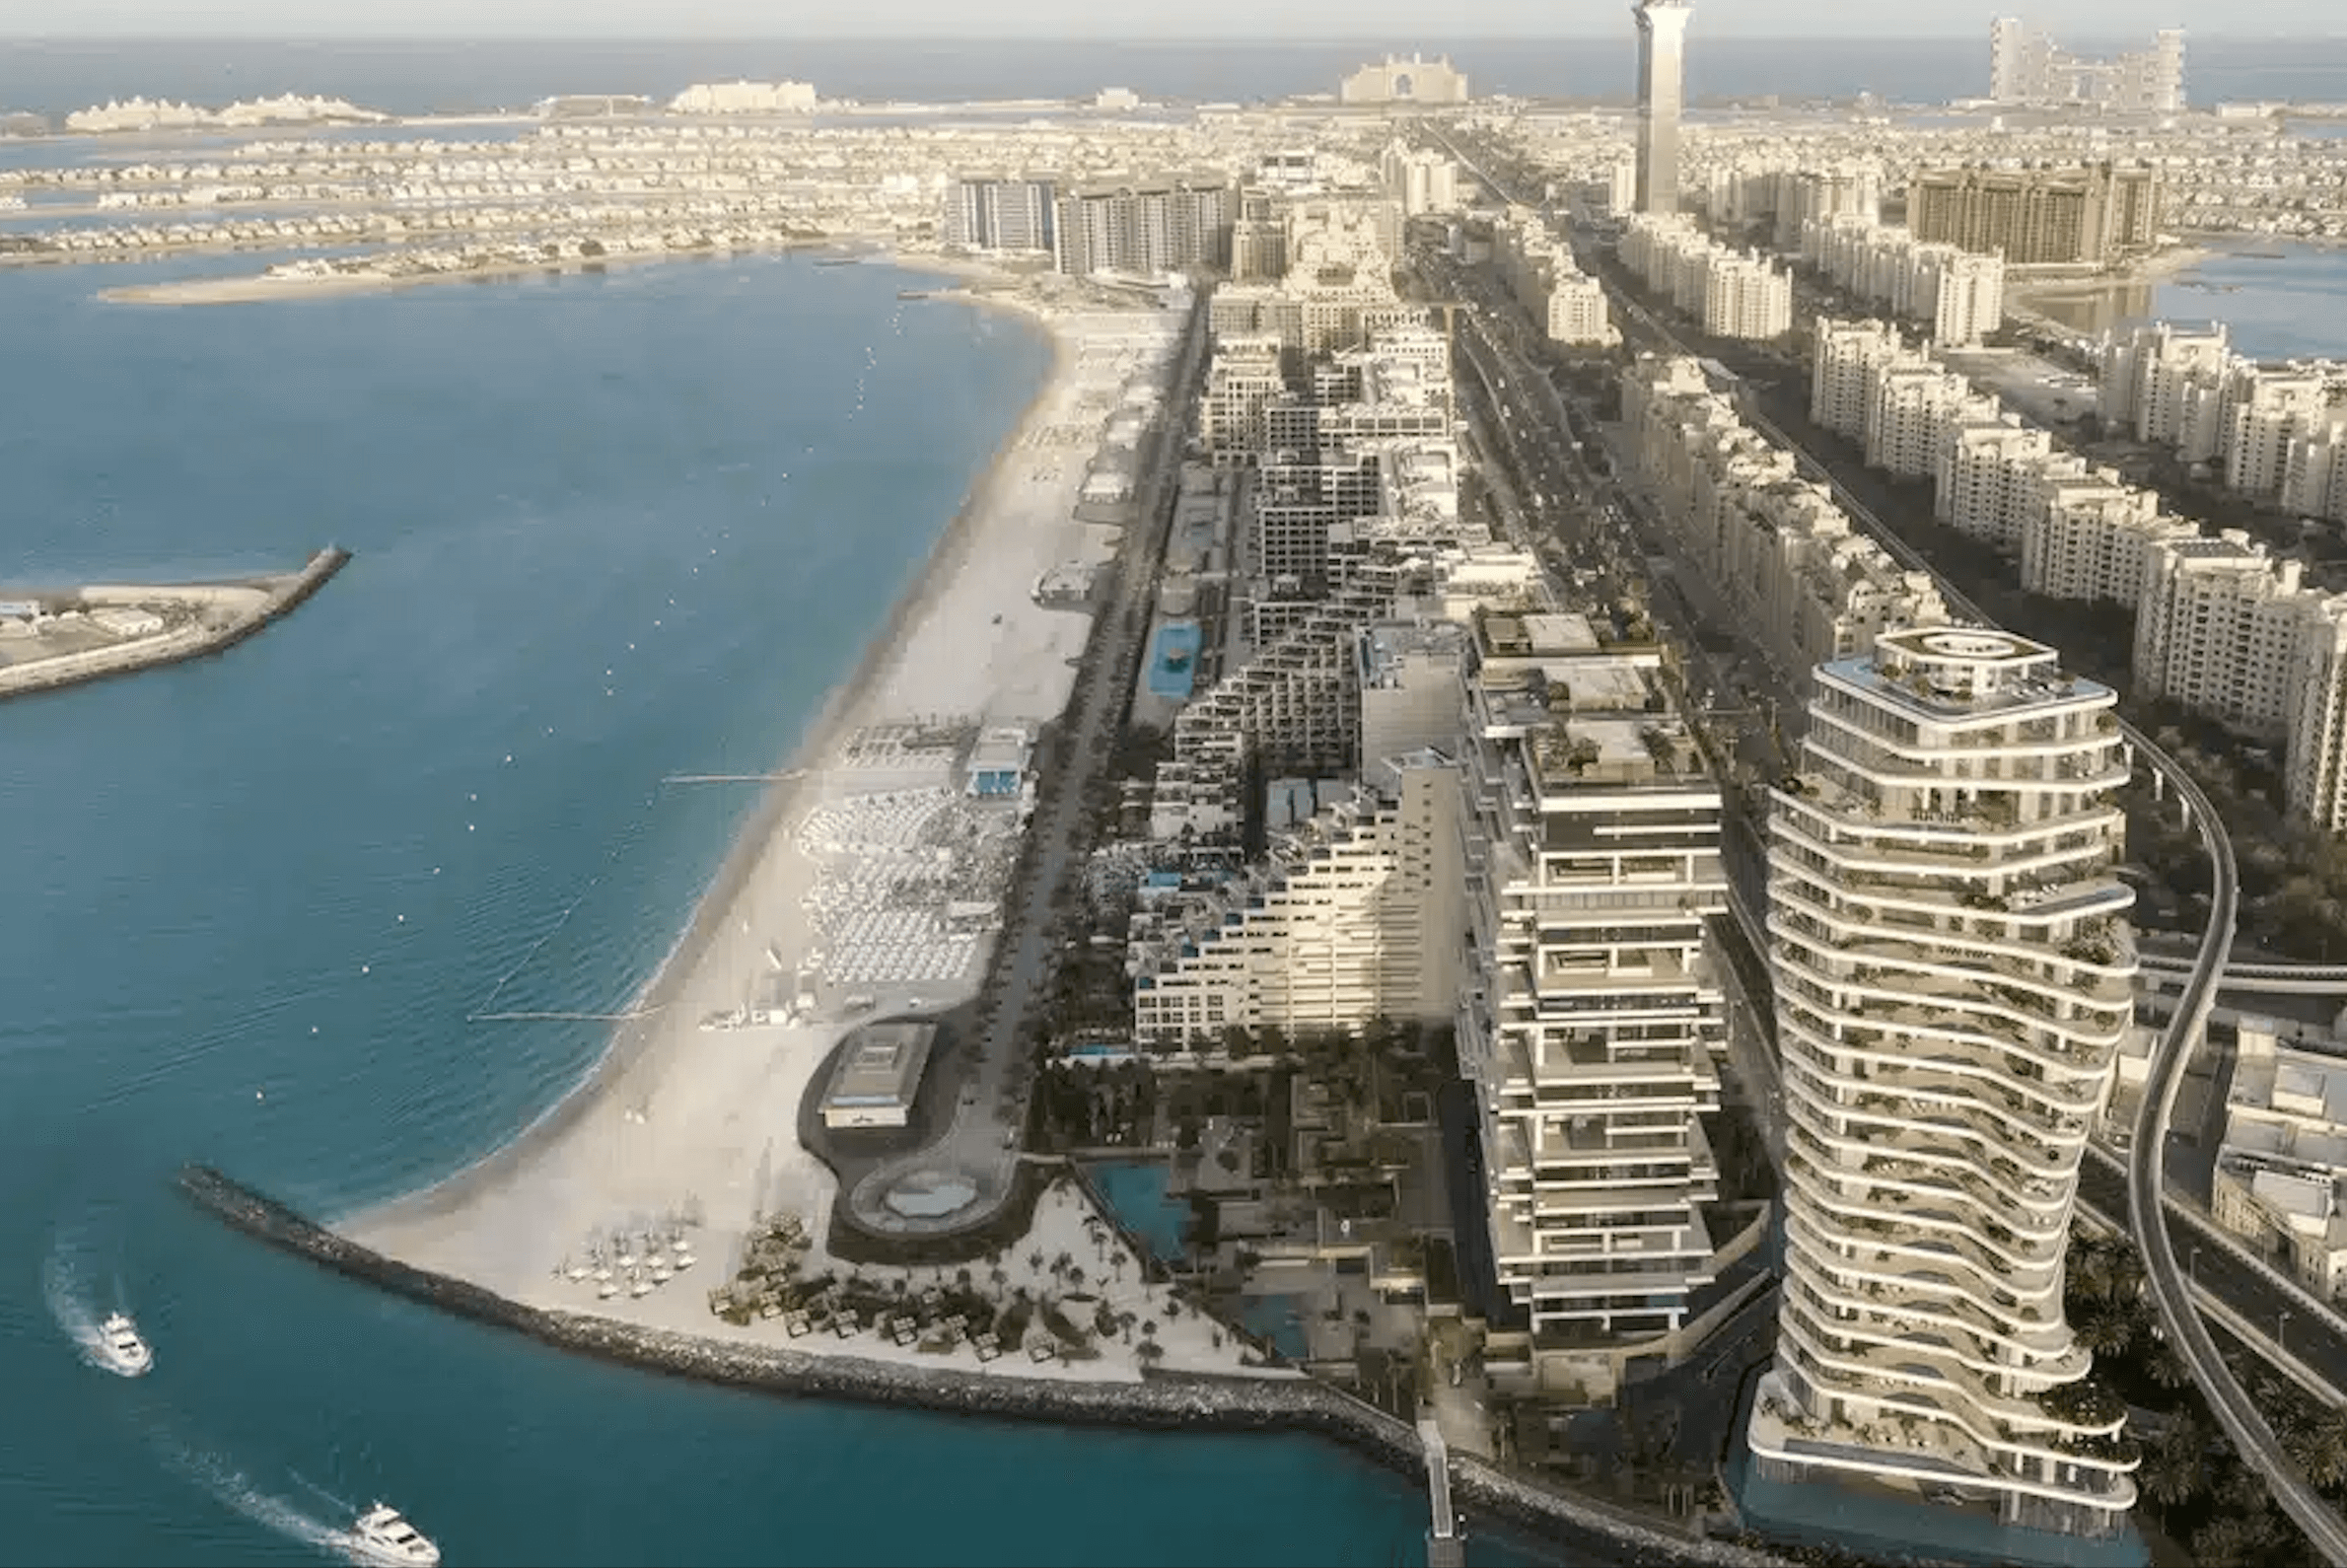
2 | Palm Jumeirah | 3.8 | 159 |
3 | Business Bay | 3.6 | 1,055 |
4 | Mina Rashid | 3.1 | 899 |
5 | Al Yelayiss 1 | 3.0 | 72 |
What does this actually say?
Umm Suqeim First and Palm Jumeirah: low transaction counts, very high total value – clearly high-ticket, luxury driven.
Business Bay and Mina Rashid: high activity and high value; these are arguably the “engine rooms” of the mid-to-upper segment in November.
Al Yelayiss 1: still under the radar for many end-users, yet capturing meaningful capital due to land and villa project plays.
By transaction volume
Top five areas by number of transactions:
Rank | Area | Transactions | Sales value (AED bn) |
|---|---|---|---|
1 | Jumeirah Village Circle | 1,426 | 1.9 |
2 | Wadi Al Safa 5 | 1,133 | 1.8 |
3 | Business Bay | 1,055 | 3.6 |
4 | Dubai South | 903 | 2.1 |
5 | Mina Rashid | 899 | 3.1 |
Here, a very different picture emerges:
JVC is the transaction king: a classic mid-market hub with strong investor and tenant demand.
Wadi Al Safa 5 sits in the broader Dubailand corridor – lots of townhouse and villa-style stock that appeals to young families.
Dubai South is a long-term play linked to Al Maktoum International Airport, logistics clusters, and Expo City. It looks “far” on the map, but if you believe in the macro, the pricing today may start to feel surprisingly low in hindsight 10 years from now.
If you are weighing JVC vs Dubai South vs Business Bay as an investor, it might help to think of them as three distinct roles in your portfolio:
JVC – yield and liquidity.
Business Bay – slightly more expensive, but stronger corporate / tourism demand and better exit visibility.
Dubai South – more speculative, but very interesting if you are comfortable with a 8–12 year horizon.
We often design portfolios where one or two of these areas work together intentionally. If you are curious how that might look for your own capital, you can always reach out via our main site: 👉 Start your Dubai property strategy
Ultra-prime segment: where the numbers stop feeling “rational”
At the very top of the market, the November 2025 data almost reads like a different city. Here, you are not really discussing rental yields. You are looking at status, scarcity, and global capital more than anything else.
Most expensive apartments sold (November 2025)
# | Project | Price (AED) |
|---|---|---|
1 | Jumeirah Residences Asora Bay at Jumeirah First | 203M |
2 | Lot A – Residences Principal Lot at DIFC | 193M |
3 | Solaya 2 at Jumeirah First | 82M |
4 | Aman Residences Dubai – Tower 1 at Jumeirah Second | 81M |
5 | Orla Infinity by Omniyat at Palm Jumeirah | 62M |
If we are honest, these transactions have almost nothing in common with a typical AED 1.3M off-plan one-bed. They are driven by:
Ultra-high-net-worth individuals consolidating global holdings.
Brand power: Aman, Omniyat, DIFC-adjacent residences, signature architects.
Unrepeatable locations – direct beachfront, private marinas, curated low-density enclaves.
These deals matter because they anchor price psychology. When you read about a 200M apartment, a 5M–7M penthouse suddenly feels more “normal” to many buyers, even though it is objectively still a very large number.
Most expensive villas sold (November 2025)
# | Area | Price (AED) |
|---|---|---|
1 | Palm Jumeirah | 110M |
2 | Al Hebiah Fourth | 104M |
3 | Wadi Al Safa 3 | 69M |
4 | Me’aisem Second | 61M |
5 | Al Thanayah Fourth | 59M |
The Palm needs no explanation. What is maybe more interesting is the presence of areas like Al Hebiah Fourth, Wadi Al Safa 3, and Me’aisem Second, where land consolidation, custom builds, and cluster villa projects create pockets of ultra-prime value in what used to be more mid-range corridors.
For most investors, these numbers are aspirational rather than actionable. But they do tell you something important: Dubai’s top-end is now priced firmly in the global luxury league – not as an outlier, but as a recurring pattern. That has implications for everything below, because global capital does not always stay at the top; it often “trickles down” into near-prime communities in the next cycle.
Resale market: where the smart money quietly moves
Despite the dominance of off-plan, the resale market still absorbed around 30% of sales volume and 36% of total value in November 2025. That is not a small number.
From the data you shared, the top resale apartment projects by volume were:
# | Project | Volume | Value (AED) | Median price (AED) |
|---|---|---|---|---|
1 | Azizi Riviera (All Buildings) | 95 | 76.1M | 720K |
2 | Creek Beach – Canopy | 44 | 105M | 2.4M |
3 | Sobha Hartland – The Crest | 39 | 92.4M | 2.4M |
4 | Casa Flores & Eden Apartments | 35 | 41.5M | 1.3M |
5 | Elite Sports Residence | 35 | 19.7M | 490K |
And for resale villas:
# | Project | Volume | Value (AED) | Median price (AED) |
|---|---|---|---|---|
1 | Rukan 3 | 24 | 33.7M | 1.4M |
2 | Mudon Al Ranim 3 | 17 | 67.1M | 3.8M |
3 | The Valley – Talia | 17 | 52.2M | 2.8M |
4 | Aura | 14 | 68.9M | 4.4M |
5 | Maha Townhouses | 13 | 40.6M | 3M |
What I find interesting here is that these are mostly communities with clear, understandable stories:
Riviera and Elite – more budget-friendly, high-yield-focused stock near established zones.
Creek Beach, Sobha Hartland – newer prime waterfront / canal-adjacent communities with strong branding.
Mudon, The Valley, Aura – family-centric townhouse and villa clusters with parks, schools, and community centres.
In other words, the resale market is not just distressed sellers and random opportunistic trades. It is increasingly a curated layer where investors reshuffle their portfolios between phases of the cycle.
If you are thinking about selling a unit you bought three or four years ago and reallocating capital, it is worth approaching resale strategically – not just by listing on a portal and waiting. This is exactly why we built a dedicated “sell-side” offering at Totality: to treat resale as a deliberate portfolio move rather than an afterthought. You can learn more on our main site here: 👉 Totality Real Estate – Dubai property advisory
Mortgages and leverage: confidence, but a bit more measured
Finally, a quick word on financing.
In November 2025:
Mortgage transactions: 4,521
YoY change: +13.2% vs November 2024
Total mortgaged value: AED 14.7B, up around 4% YoY
The gap between transaction growth (+13.2%) and mortgaged value growth (+4%) hints at something subtle:
More people are using mortgages, but average loan sizes are not exploding at the same rate as transaction counts.
There are several possible interpretations:
Some buyers are opting for lower leverage, using more cash to de-risk in a mature phase of the cycle.
A higher share of mortgages may be concentrated in mid-market communities rather than ultra-prime, which lifts counts without equally lifting aggregate value.
Or simply, banks are being a bit more conservative with valuations and loan-to-value ratios after several years of sustained price growth.
Either way, the data does not suggest a wildly over-leveraged environment, at least not yet. That does not mean there is no risk – it just means the risk is more about future supply and affordability than about a classical debt bubble.
Commercial real estate: Grade A offices and a quieter, more serious boom
If the residential market is loud, the commercial market – especially Grade A offices – is more like a low, steady hum in the background. But it is powerful.
From the numbers you shared, average commercial rents around AED 90,000 per year, up a huge 78.2% vs November 2024, already tell you the direction of travel. Pair that with what the major consultancies are reporting and a pattern emerges:
Prime office occupancy in key districts like DIFC and Business Bay is above 95%, with citywide office occupancy around 92%.
Global reports have Dubai ranking among the top 10 most expensive prime office markets in terms of occupancy costs – not because it suddenly became “overpriced”, but because demand caught up with limited high-quality supply.
Several sources point to double-digit growth in office rents throughout 2024 and into 2025, and a further 10–12% uplift expected in 2025 as new companies set up regional hubs here.
If you put this next to what is happening on the residential side, the contrast is interesting:
Residential vs commercial snapshot – November 2025
Metric | Residential (apartments & villas) | Commercial (office / retail indicative) |
|---|---|---|
Price trend YoY | +14–30% (depending on segment) | +20–30% on prime offices (2024 into 2025) |
Average rent YoY | Apartments +11.9%, villas +7.5% | ~+78.2% YoY (from a lower base) |
Occupancy / vacancy | Tight in prime, healthy in mid-market | Prime Grade A occupancy ~92–95% |
Demand drivers | Population growth, lifestyle, yields | New companies, regional HQs, “flight-to-quality” |
Investor profile | Global HNWIs, mid-income investors, end-users | Corporate occupiers, family offices, UHNW investors |
So, yes, Dubai is still a residential story. But behind the scenes, the office market is quietly repricing upward, supported by:
Regional firms consolidating into a single, better-located HQ.
Global companies moving functions from higher-cost hubs into Dubai.
A clear flight-to-quality: older, inefficient buildings get left behind while ESG-compliant Grade A towers in DIFC, Business Bay, Dubai Harbour, and similar nodes command a premium.
For private investors, the main challenge is that institutional capital is increasingly active in the best office buildings. The “easy” strata-title office play – buy a random 1,000 sq ft unit and expect magic – is not as forgiving as it once was. Returns can still be attractive, but they are much more sensitive to building selection, fit-out quality, and tenant profile than most glossy brochures admit.
Driving factors: why Dubai kept attracting capital in 2025
Numbers never move in isolation. The November 2025 results sit on top of several powerful drivers that have been compounding for years.
1. Visa reforms and the 10-year Golden Visa
For many international investors, the Golden Visa is the first hook. The rule is simple enough to remember:
Own one or more properties with a total value of at least AED 2 million, and you can typically qualify for a 10-year renewable residence permit (the “Golden Visa”), subject to standard checks.
Off-plan also qualifies in many cases, as long as certain completion and payment thresholds are met. This means that the jump from “I like Dubai as a holiday destination” to “I live here and use it as my global base” is now more direct.
From an investment perspective, the Golden Visa does three things at once:
Increases stickiness – investors stay longer, bring families, and spend more locally.
Encourages portfolio expansion – once you live here, adding a second or third property feels more natural.
Stabilizes demand through cycles – long-term residents behave differently from pure speculators.
2. Government initiatives and long-horizon master plans
Policies like the Dubai 2040 Urban Master Plan and the D33 economic agenda are not just slogans; they translate into infrastructure budgets, zoning decisions, and population targets that the real estate market eventually has to absorb.
D33 aims to double the size of Dubai’s economy in the next decade and push the city into the top three global urban economies.
The 2040 plan sets out where future housing, logistics, tourism, and green corridors will go – which communities grow first, and which will feel “early stage” for a while.
When you buy in Dubai South, Dubai Islands, or around Expo City, you are arguably not just buying a floor plan. You are buying into that longer narrative. It does not guarantee returns – nothing does – but it at least gives you a surface to think on.
3. Population growth and the expat base
Dubai’s population has grown by roughly half a million residents since 2020, reaching around 3.8 million residents by late 2024, and it continues to trend upward.
That might sound abstract, so let’s ground it:
Every new cluster of jobs in aviation, logistics, finance, tech, and tourism needs nearby housing.
A significant share of new arrivals are mid-to-high-income professionals, not just transient workers.
Many of them now stay longer, thanks to friendlier visa rules and a more stable perception of Dubai as a long-term home rather than a short stopover.
This is one reason why mid-market communities like JVC, Wadi Al Safa 5, Dubailand corridors, Dubai South etc. show such strong transactions: they absorb the housing needs of that expanding expat middle class.
4. Tax environment and comparables
Even after several years of price growth, international buyers still compare Dubai to London, Paris, New York, or Singapore and conclude that:
For the same dollar amount, they often get more space, newer stock, and lower running costs.
There is no recurring property tax in Dubai (though of course you do have DLD transfer fees, service charges, and maintenance costs).
There is no tax on rental income or capital gains on property at the time of writing, which makes net yield calculations cleaner than in most Western markets.t
This combination is part of why global capital kept flowing into the city throughout 2024–2025, even as some analysts started to warn of overheating.
Risks and where we are in the cycle
It would be dishonest to present November 2025 as unambiguously “all clear, all green lights”. Several risk signals are flashing in the background.
Rating agencies like Fitch have already flagged a potential double-digit price correction (up to ~15%) in late 2025–2026, driven mainly by a record pipeline of new supply – an estimated 210,000 units potentially delivering in a relatively short window.
Independent price indexes show that since early 2021, Dubai residential values have risen roughly 60–75%, the longest and strongest rally since before the 2008 crisis.
Launch volumes remain extremely high; November 2025 alone saw more than 17,700 units released off-plan. That is both a vote of confidence and a source of future inventory.
If you are an investor, the key risk is not necessarily a catastrophic crash like 2009. Structural reforms, stricter mortgage caps, and better developer oversight make that less likely. The more realistic danger is:
A gradual oversupply in certain segments (especially standardised mid-range apartments in overbuilt corridors).
Yield compression if rents cannot keep rising at current speeds while prices continue to climb.
Liquidity risk in fringe communities or in projects that do not stand out once dozens of similar buildings complete.
In simple terms, the phase of the cycle we are in now rewards selectivity and data, not blind participation.
Outlook for 2026 and beyond: where opportunity still lives
So, what might the next few years look like? No one knows for sure, and I would be suspicious of anyone who claims they do. But, based on current data, three broad scenarios seem plausible:
Soft landing (baseline)
Price growth slows to somewhere between –3% and +3% per year on average.
Some communities correct mildly; others stagnate; a few niche pockets still rise.
Rental growth normalises but remains positive in areas with strong job growth and limited new supply.
Selective correction
Oversupplied, undifferentiated apartment corridors see sharper declines, potentially 10–15% over 1–2 years.
Well-located villas, waterfront communities, and truly prime stock hold up much better, with far smaller drawdowns.
Yields improve in some cases as prices relieve a bit of pressure.
Extended plateau with pockets of strength
Macro conditions remain favourable (oil, tourism, regional stability), and demand from new expat waves stays high.
Instead of a sharp correction, the market “sideways drifts” while inflation quietly erodes real prices.
Specific themes – logistics hubs, airport cities, branded hospitality-backed residences – outperform the average.
In all three scenarios, there is still room for rational, well-structured investments. But the days when almost any purchase at any price point looked clever a year later are probably behind us, at least for this particular cycle.
In our work at Totality Real Estate, we increasingly focus on three types of opportunity:
Cash-flow-first apartments in communities like JVC, Dubai South, parts of Business Bay and Dubai Creek Harbour, carefully selected for layout, service charge efficiency, and rental profile.
Mid-to-upper-range villas and townhouses where end-user demand is durable – clusters in Mudon, The Valley, Aura, Bay Villas – Dubai Islands, etc.
Value-add holds, where you can improve yield or exit price via better furnishing, holiday-home operation, or targeted renovations rather than just hoping for market appreciation.
FAQs – Dubai real estate market November (2025)
Q1. Is November 2025 a good time to invest in Dubai property?
It depends on your time horizon and risk tolerance. Prices have already risen strongly over the last few years, and some analysts expect a possible correction as new supply completes. However, rental demand remains strong, yields are still attractive in the right communities, and long-term fundamentals – visas, infrastructure, population growth – are supportive. If you select carefully and focus on cash flow rather than speculation, it can still be a sensible entry point.
Q2. Which areas performed best in November 2025?
On a value basis, Umm Suqeim First, Palm Jumeirah, Business Bay, Mina Rashid, and Al Yelayiss 1 led the month. By transaction volume, Jumeirah Village Circle, Wadi Al Safa 5, Business Bay, Dubai South, and Mina Rashid were the most active. Each plays a different role: some are ultra-prime, some are mid-market workhorses, and others are long-term development stories.
Q3. Are off-plan properties still better than ready units for investors?
Off-plan dominated November 2025, with roughly 70% of transactions, largely because of flexible payment plans and strong launch marketing. But “better” depends on your goals. Off-plan can offer lower entry prices and potential capital gains by handover, but carries construction, delay, and exit risk. Ready units in proven rental communities often give more immediate, visible cash flow. A balanced portfolio usually blends both.
Q4. What rental yields can I expect in Dubai right now?
Market-wide averages suggest around 5–6% gross yields for apartments and slightly lower for villas, but that hides big variations. Compact, well-designed units in areas like JVC or Dubai South can sometimes reach 7–8% gross yields, especially when combined with efficient property management or short-term rental strategies. Prime beachfront or branded residences may show lower yields on paper but offer different types of value, such as capital preservation or lifestyle benefits.
Q5. Does buying a property in Dubai still qualify me for a Golden Visa?
Yes, in most cases. If you buy one or more properties with a total value of at least AED 2 million, you can typically apply for a 10-year Golden Visa as a real estate investor, provided you meet the other requirements and documentation rules set by the authorities. This applies to both completed and certain off-plan properties, although additional conditions may apply in the off-plan case.