The Dubai real estate market witnessed significant activity in October 2024, demonstrating robust growth in various sectors. Below is an in-depth analysis based on key metrics, the performance of property types, top areas, and leading projects.
The Key Metrics for October 2024 provide an overview of the significant data points from the Dubai real estate market for that month, showcasing the performance and growth compared to the same period in the previous year.
Total Sales Volume: This metric indicates the total number of property transactions completed in October 2024. A total of 20,461 transactions were recorded, which represents a substantial 68.5% increase compared to October 2023. This growth suggests heightened market activity and increased interest in buying and selling real estate in Dubai.
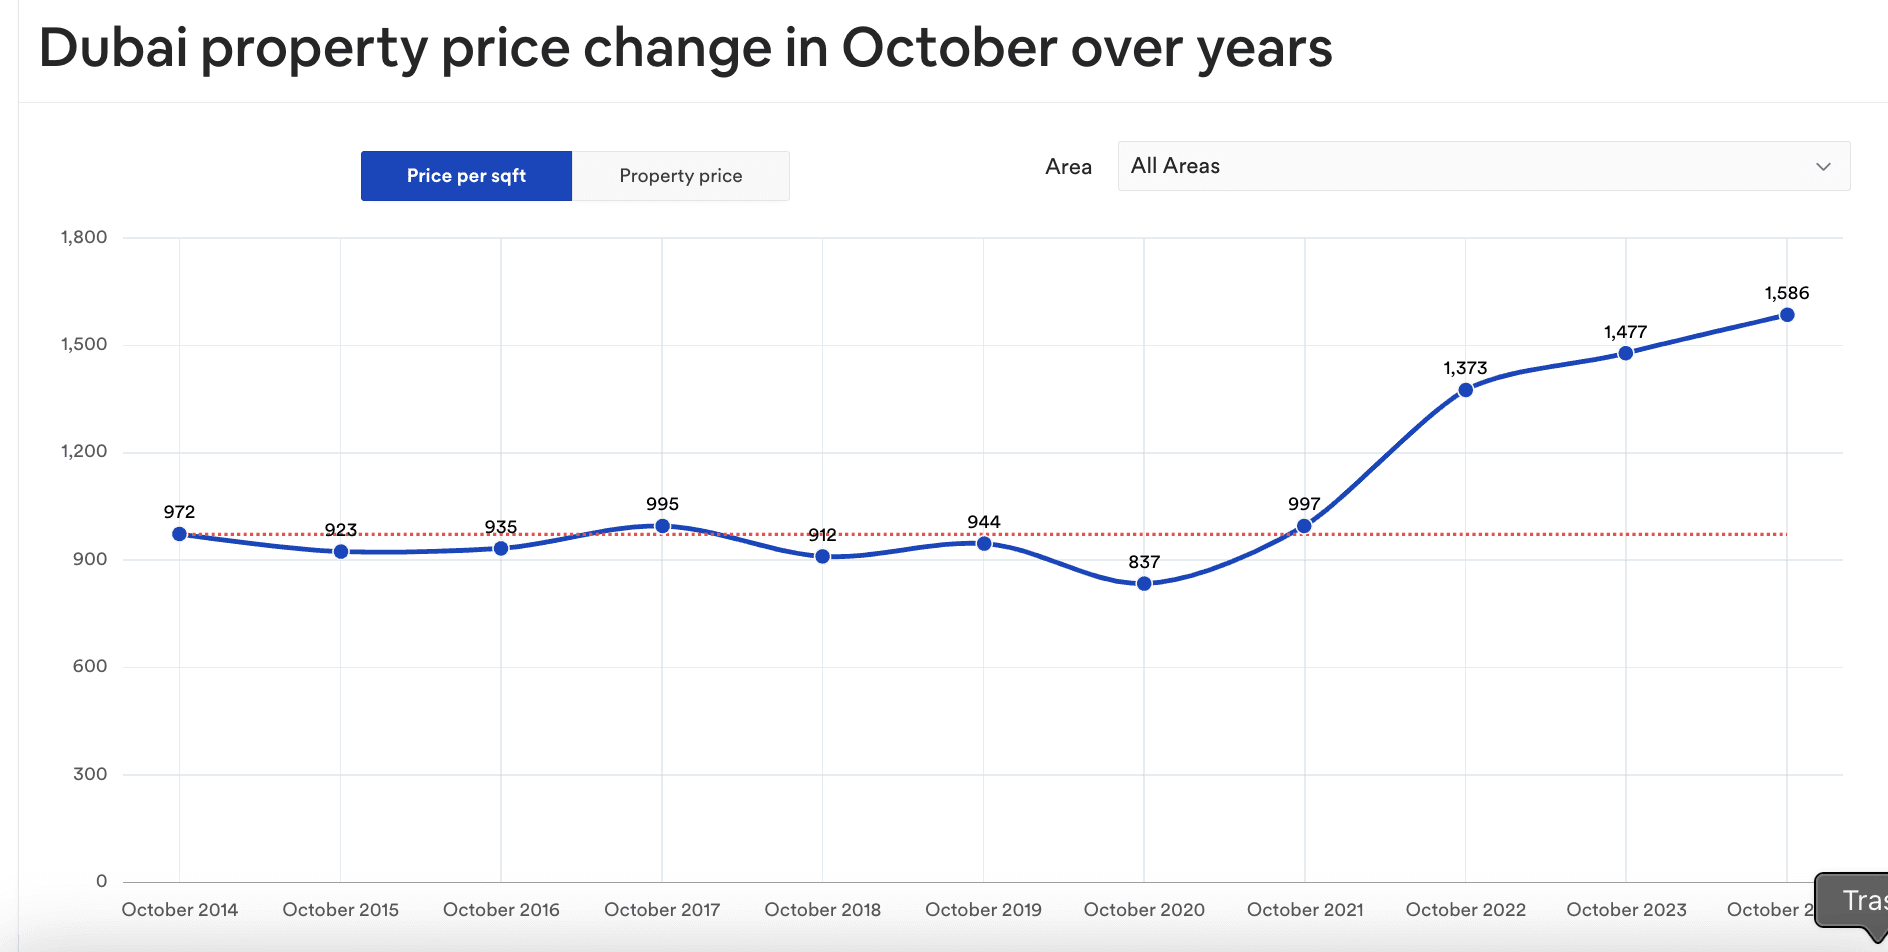
Price per Square Foot: This metric reflects the average cost of property per square foot across all transactions. In October 2024, the price was AED 1,585 per square foot, showing an increase of 7.1% from October 2023. This rise indicates an upward trend in property values, pointing to strong demand and a potentially competitive market.
Total Sales Value: This metric captures the cumulative value of all real estate transactions during the month. For October 2024, the total sales value reached AED 61.1 billion, marking a 54.5% increase from October 2023. This significant jump suggests that the overall market value has grown, driven by both the higher volume of transactions and the increased price per square foot.
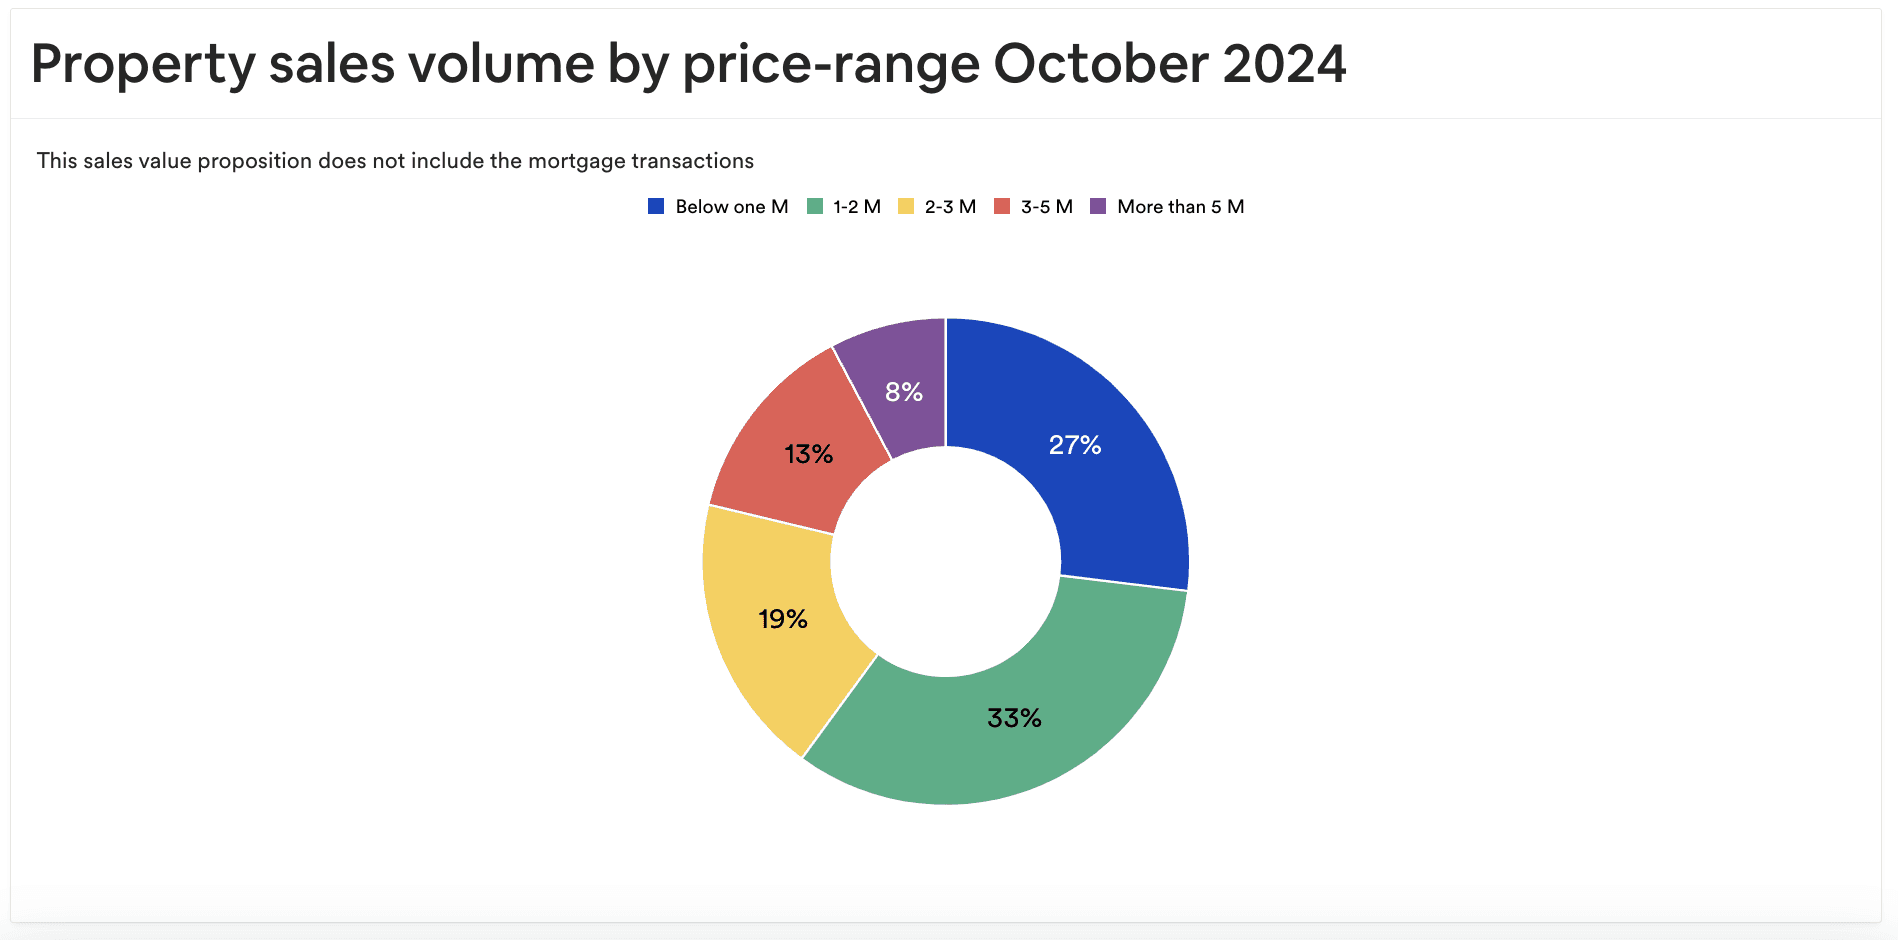
Breakdown by Property Type
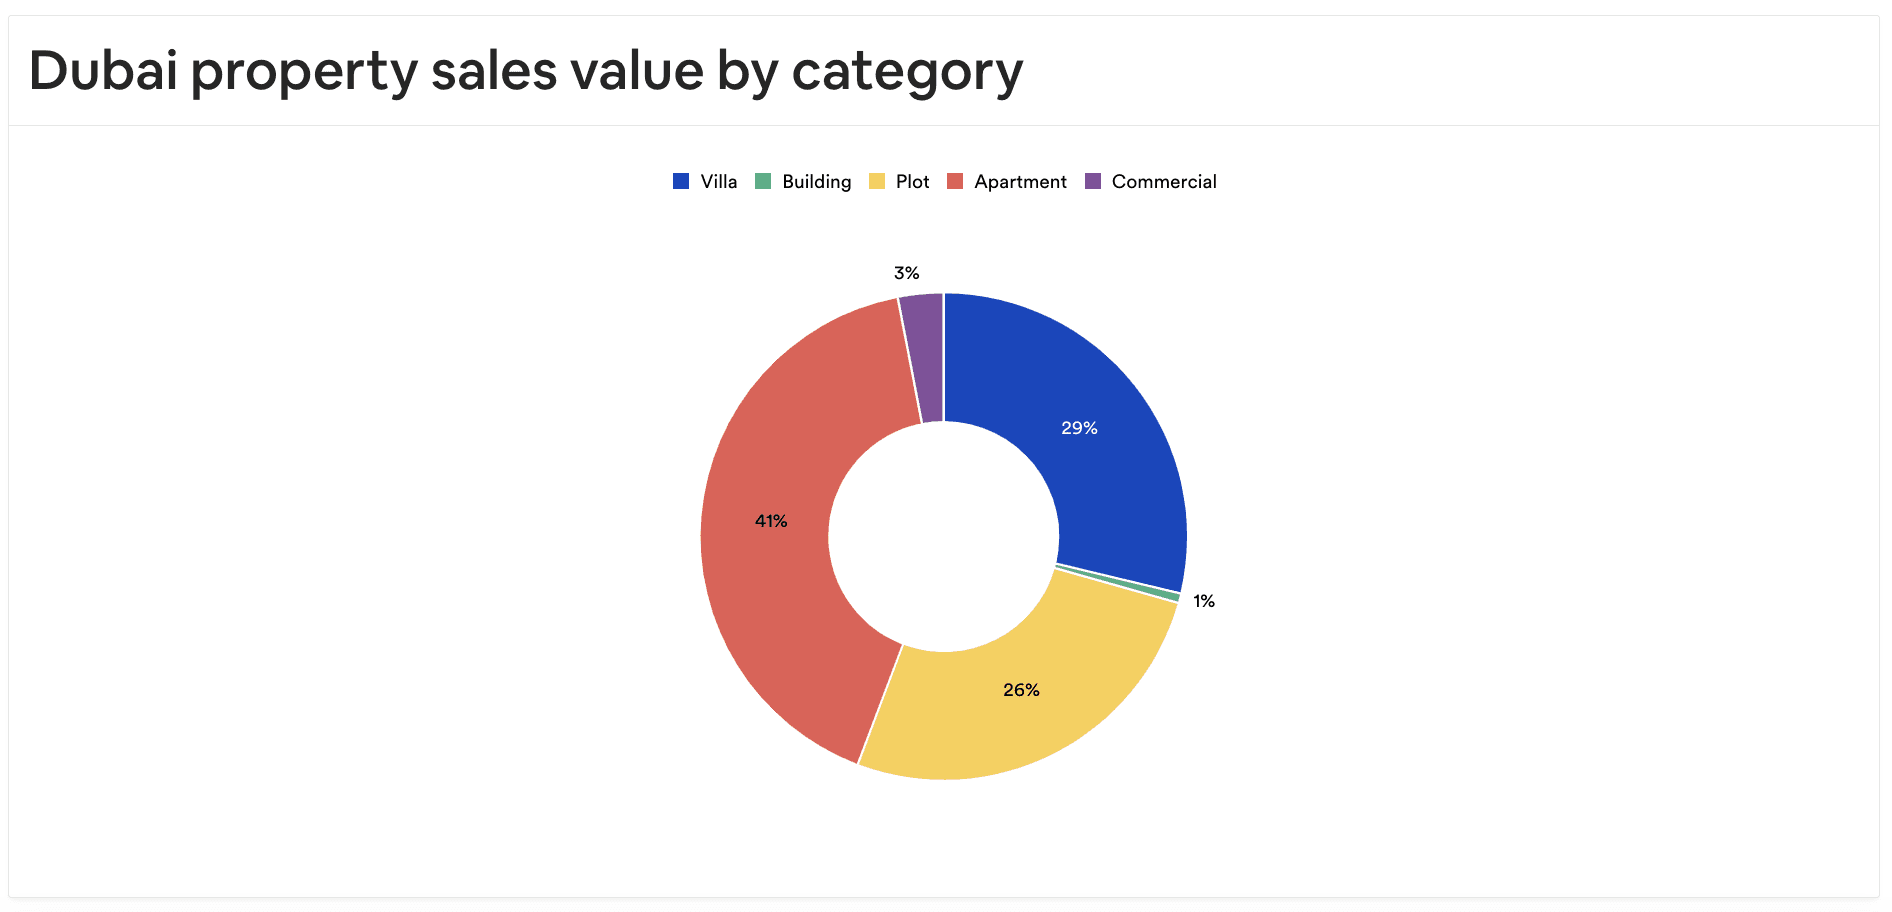
Apartments: 15,662 units sold (+67.2% YoY), total value AED 28.1 billion.
Villas: 3,830 units sold (+102% YoY), total value AED 20.5 billion.
Commercial Properties: 424 units sold (-1.9% YoY), total value AED 916.2 million.
Buildings: 12 units sold (+300% YoY), total value AED 501.1 million.
Plots: 533 transactions (+21.1% YoY), total value AED 11.1 billion.
Property Price Trends
Average Apartment Price: AED 1.3 million (+5% YoY)
Average Villa Price: AED 3.1 million (+1.1% YoY)
Average Commercial Property Price: AED 1.4 million (+13.5% YoY)
Average Building Price: AED 12.5 million (-67.6% YoY)
Average Plot Price: AED 5.1 million (+1.2% YoY)
Rental Market Overview
Average Apartment Rent: AED 80,000/year (+14.3% YoY)
Average Villa Rent: AED 180,000/year (+10.5% YoY)
Average Commercial Rent: AED 60,000/year (-21% YoY)
Top 5 Performing Areas in October 2024
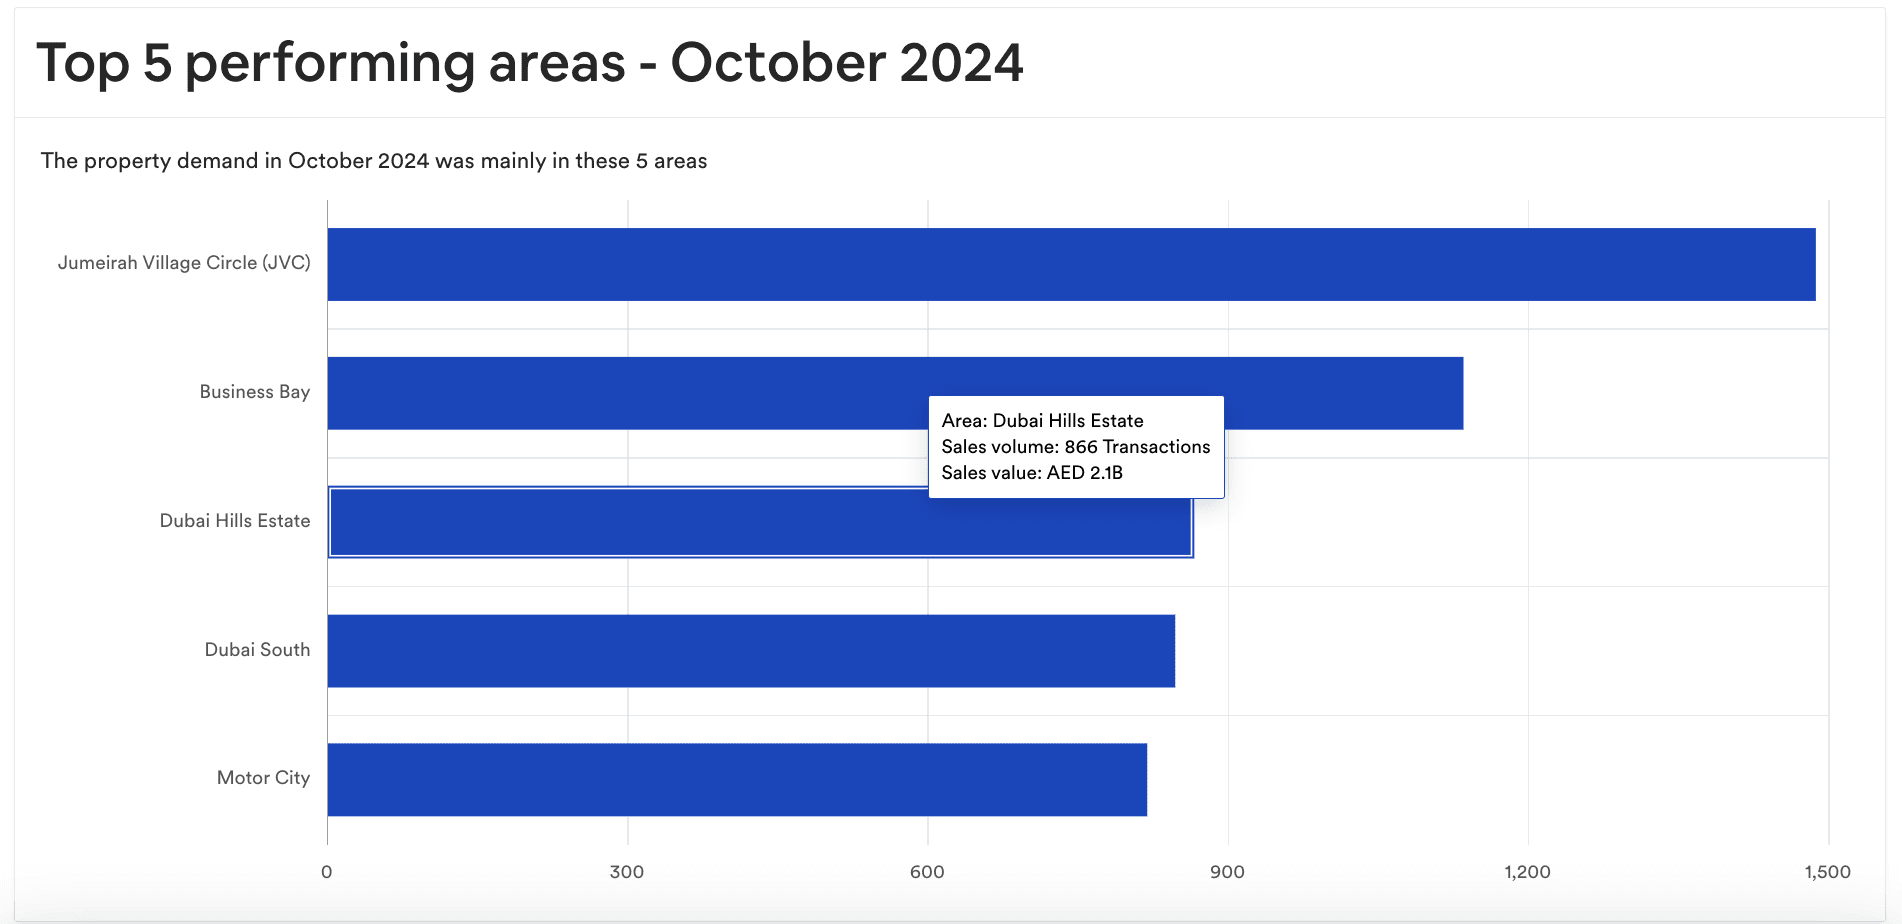
Jumeirah Village Circle (JVC)
Business Bay
Dubai Hills Estate
Dubai South
Motor City
Sale Types Comparison
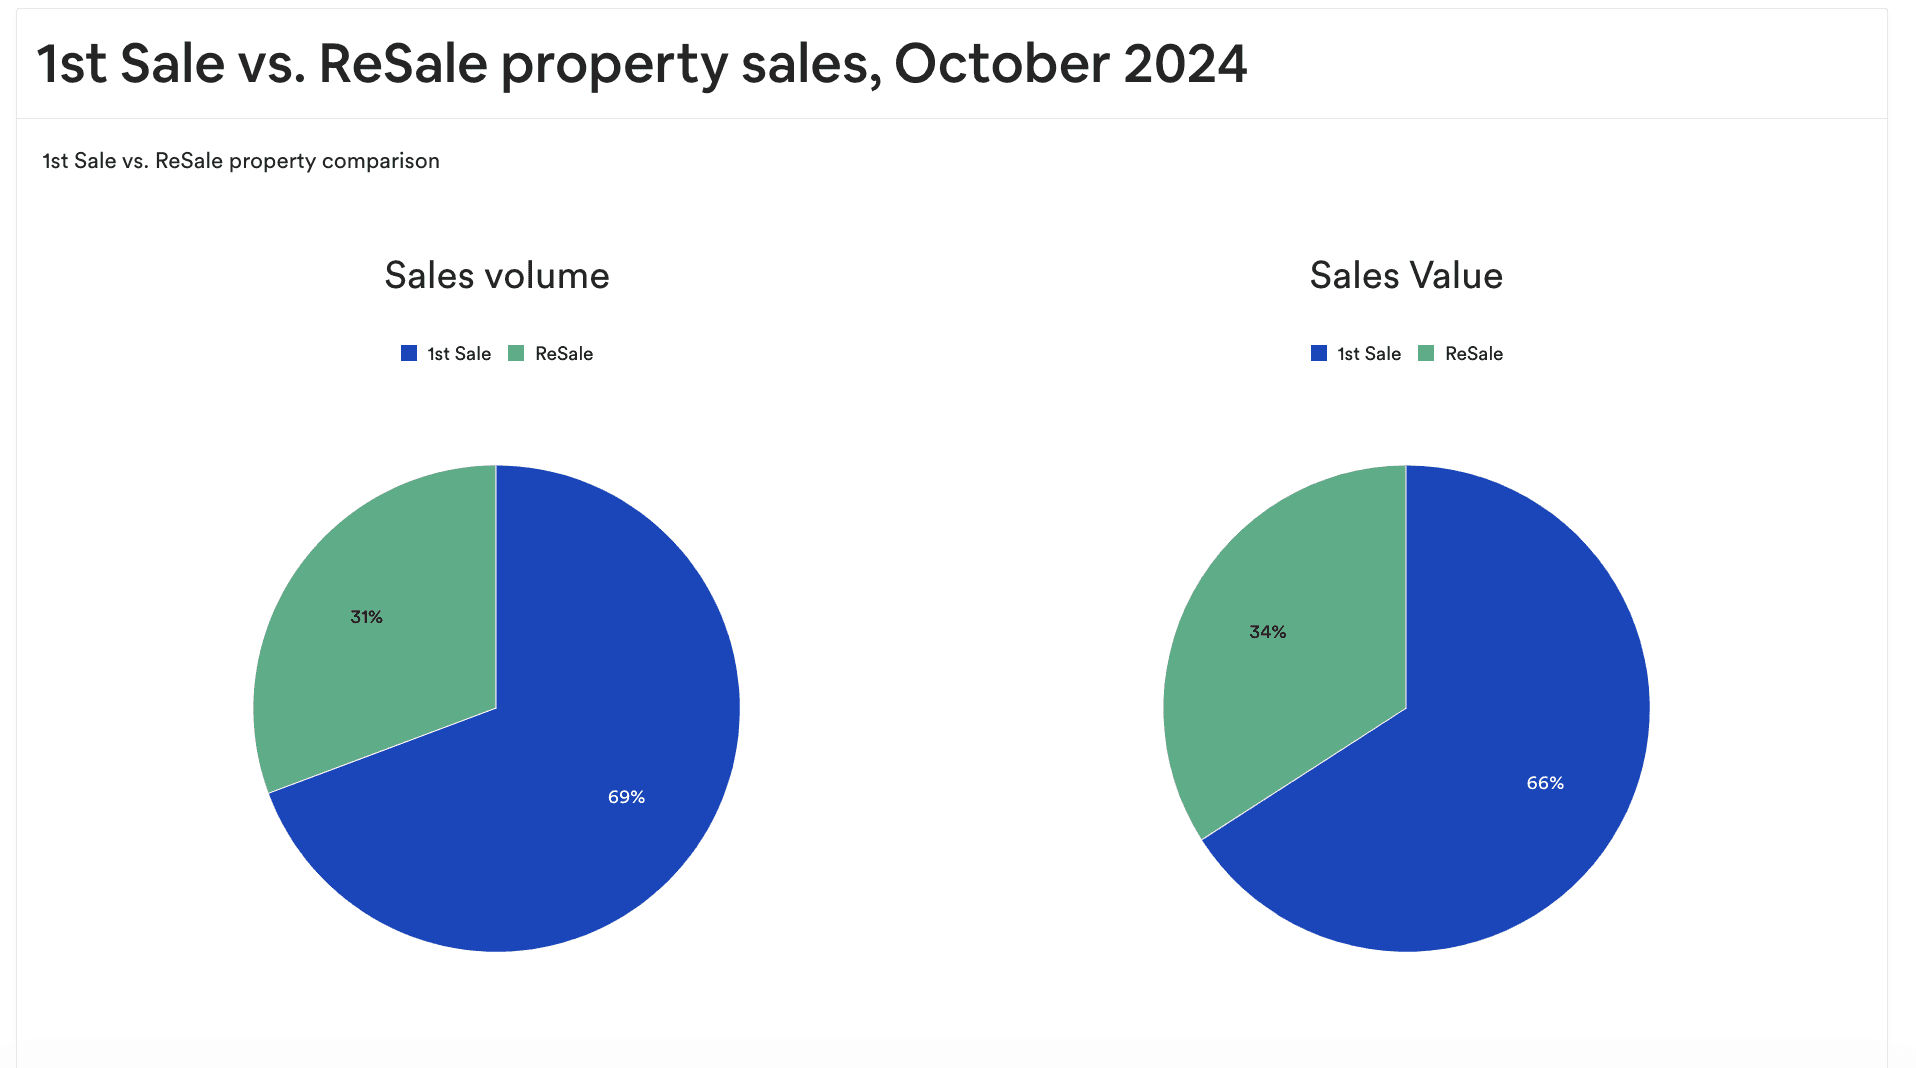
First Sale Transactions: Accounted for 69% of total sales volume and 66% of total sales value.
Resale Transactions: Made up 31% of total sales volume and 34% of total sales value.
Mortgage Activity
Number of Transactions: 4,323 (+59.9% YoY)
Total Value: AED 16.2 billion (+41.9% YoY)
Noteworthy Projects with High-Value Sales
Top 5 Most Expensive Apartments Sold:
Six Senses Residences Dubai Marina – AED 101 million
Bulgari Lighthouse Dubai, Island 2 – AED 78 million
Orla Infinity by Omniyat, Palm Jumeirah – AED 72 million
Como Residences, Palm Jumeirah – AED 54 million
One Za'Abeel Tower, Zaabeel First – AED 53 million
Top 5 Most Expensive Villas Sold:
Eome, Palm Jumeirah – AED 171 million
Mohammed Bin Rashid Al Maktoum City – District One, Phase 1 – AED 53 million
The First Collection at Dubai Studio City – AED 48 million
Amali Island, The World – AED 48 million
The Beachfront Villas by Ellington, Wadi Al Safa 3 – AED 38 million
Best-Selling Projects in October 2024
Off-Plan Apartments:
Sobha Orbis – 761 units, AED 891.6 million total sales value.
Damac Hills (2) - Elo 2 & Elo 3 – 433 units, AED 335.5 million.
Cilia – 310 units, AED 702.2 million.
Address Residences L Dubai Hills Estate – 287 units, AED 780.7 million.
Verdes by Haven 1 – 264 units, AED 401.4 million.
Off-Plan Villas:
Greenridge – 332 units, AED 1.1 billion total sales value.
Damac Riverside - Lush – 312 units, AED 895.1 million.
Damac Riverside - Ivy – 246 units, AED 697.3 million.
Damac Riverside - Sage – 238 units, AED 698.7 million.
Athlon by Al Dar – 194 units, AED 657.6 million.
Ready Apartments:
Canal Front Residences – CF3 & CF4 – 92 units, AED 258.9 million total sales value.
Remraam – 75 units, AED 57.7 million.
Binghatti Corner – 44 units, AED 45.7 million.
Sky Courts – 38 units, AED 24.1 million.
Rukan – 37 units, AED 19.2 million.
Ready Villas:
Shams Townhouses – 16 units, AED 42.4 million total sales value.
Mag Eye Phase 1 – 15 units, AED 43.8 million.
The Fields at D11 – MBRMC – 14 units, AED 55.8 million.
Arabian Ranches III – Ruba – 9 units, AED 30.2 million.
Arabian Ranches III – Joy – 9 units, AED 26.9 million.
Data & Images provided by dxbinteract.com


