
The September numbers are in, and they tell one clear story: Dubai lost volume fast and price slowly. Transactions fell 44% against a year ago while the citywide average held within 2.4%. The whole contraction sits in off-plan, and the segments are now pulling in different directions. Here is the full read, straight from the DLD register, with what it means if you are buying, selling or holding.
Executive Summary
Dubai recorded 11,288 property sales worth AED 29.4 billion in September 2026. That is 44.4% fewer transactions and 45.8% less value than September 2025. Against August 2026, transactions fell 6.1% while value rose 2.9%.
Prices have stopped rising. The Dubai-wide average stood at AED 1,650 per sq. ft., down 2.0% MoM and 2.4% YoY. The market is losing volume quickly and price slowly.
The contraction sits almost entirely in off-plan. Off-plan sales fell 51.8% YoY to 7,271 deals, and off-plan value fell 57.6% to AED 15.5 billion. The secondary market held up far better, with 4,017 resale transactions worth AED 13.9 billion. That is about 23% below September 2025 but roughly 10% above August. Resale now accounts for 47% of sales value, against about 33% a year ago.
Three signals matter for investors:
- Mortgage registrations rose 6.5% YoY to 4,038 while sales fell 44%. Financed end users are still buying. Launch-driven investors are not.
- Rents are falling. Apartment rents are down 4.1% YoY and villa rents are down 14.6%.
- The top of the market is still trading. September’s largest villa sale was AED 260 million on Palm Jumeirah.
The question for a buyer in Q4 2026 is which segment and which building, because the segments are now moving in different directions.
September 2026 Dubai Real Estate Market at a Glance
| Metric | September 2026 | August 2026 | September 2025 | MoM | YoY |
|---|---|---|---|---|---|
| Total transactions | 11,288 | 12,020 | 20,300 | -6.1% | -44.4% |
| Total sales value | AED 29.4B | AED 28.6B | AED 54.2B | +2.9% | -45.8% |
| Average price per sq. ft. | AED 1,650 | AED 1,684 | AED 1,691 | -2.0% | -2.4% |
| Average transaction value | AED 2.60M | AED 2.38M | AED 2.67M | +9.6% | -2.5% |
| Off-plan transactions | 7,271 | 8,360 | 15,090 | -13.0% | -51.8% |
| Off-plan sales value | AED 15.5B | AED 16.2B | AED 36.6B | -4.5% | -57.6% |
| Secondary transactions | 4,017 | 3,660 | 5,220 | +9.6% | -23.0% |
| Secondary sales value | AED 13.9B | AED 12.3B | AED 17.7B | +12.6% | -21.4% |
| Apartment transactions | 9,055 | 10,030 | 17,280 | -9.7% | -47.6% |
| Villa and townhouse transactions | 1,428 | 1,370 | 2,120 | +3.9% | -32.7% |
| Commercial transactions | 539 | 420 | 510 | +27.7% | +5.3% |
| Plot transactions | 237 | 185 | 375 | +28.8% | -37.1% |
| Mortgage registrations | 4,038 | 3,770 | 3,790 | +7.2% | +6.5% |
| Mortgage value | AED 16.2B | AED 14.4B | AED 11.8B | +12.7% | +37.6% |
MoM = month over month. YoY = year over year. September 2026 figures and all percentage changes for the total market and for off-plan are as published. August 2026 and September 2025 values are back-calculated from those percentages and rounded. Secondary market figures and average transaction values are Totality Real Estate calculations.
Key findings
- Volume is down by almost half. 11,288 sales against roughly 20,300 in September 2025. It was the second-weakest month of the past twelve, after May 2026.
- Prices are flat to slightly lower. AED 1,650 per sq. ft. is 2.4% below September 2025. Volume has corrected far more than price.
- Off-plan carried the decline. Off-plan transactions fell 51.8% YoY. Resale fell about 23%.
- Resale grew on the month. Secondary transactions rose roughly 10% MoM and secondary value about 13%.
- Off-plan’s share fell to 64.4% of deals, the lowest in the twelve months shown, and to 52.7% of value.
- Average ticket size rose 9.6% MoM to AED 2.60 million because apartments fell while villas, commercial property and plots rose.
- Mortgage value rose 37.6% YoY to AED 16.2 billion. The average registration was about AED 4.0 million.
- Rents are falling faster than prices, which compresses gross yields, most visibly on villas.
Data and method
This report uses September 2026 and Q3 2026 transaction data from DXB Interact, which is built on Dubai Land Department (DLD) records. Sales figures include DLD direct sales and DIFC sales. They exclude mortgage registrations and gift transfers.
The report separates four kinds of statement. Facts are figures as published. Calculations are derived by Totality Real Estate and labelled as such. Interpretations are our reading of what the numbers mean. Forecasts appear only in the outlook sections. “Secondary” and “resale” mean total sales minus off-plan sales.
Dubai Property Transactions in September 2026
Dubai recorded 11,288 property transactions in September 2026, a 44.4% decrease compared with September 2025 and a 6.1% decrease compared with August 2026.
Activity is slowing. September was the second consecutive monthly decline and sits 43% below the October 2025 level of roughly 19,900 sales.
The last twelve months
| Month | Total sales | Off-plan | Secondary | Off-plan share |
|---|---|---|---|---|
| October 2025 | 19,900 | 13,900 | 6,000 | 70% |
| November 2025 | 19,000 | 13,400 | 5,600 | 71% |
| December 2025 | 18,700 | 13,600 | 5,100 | 73% |
| January 2026 | 17,300 | 11,900 | 5,400 | 69% |
| February 2026 | 17,100 | 11,400 | 5,700 | 67% |
| March 2026 | 13,600 | 10,300 | 3,300 | 76% |
| April 2026 | 14,000 | 10,700 | 3,300 | 76% |
| May 2026 | 10,200 | 7,600 | 2,600 | 75% |
| June 2026 | 14,000 | 10,400 | 3,600 | 74% |
| July 2026 | 14,100 | 9,800 | 4,300 | 70% |
| August 2026 | 12,020 | 8,360 | 3,660 | 70% |
| September 2026 | 11,288 | 7,271 | 4,017 | 64% |
September 2026 is as published. August is implied from the published MoM changes. October 2025 to July 2026 are read from the monthly volume charts and rounded to the nearest 100, so treat them as estimates. Secondary is total minus off-plan.
Three things stand out.
- The slide is in its second leg. Volumes dropped from about 17,000 a month in January and February to about 14,000 from March, dipped in May, then recovered. August and September have taken the market lower again.
- September ran 25% below the trailing twelve-month average of roughly 15,100 sales a month, and about 20% below the January to August average of roughly 14,000.
- Off-plan and resale have decoupled. Off-plan has fallen for three straight months, from about 10,400 in June to 7,271. Resale has recovered from a May low of about 2,600 to 4,017.
September in historical context
| September of | Transactions | Sales value |
|---|---|---|
| 2022 | 8,600 | AED 24B |
| 2023 | 13,600 | AED 38B |
| 2024 | 18,000 | AED 45B |
| 2025 | 20,300 | AED 54.2B |
| 2026 | 11,288 | AED 29.4B |
2022 to 2024 are read from charts and approximate. September 2026 sits between the September 2022 and September 2023 levels on both count and value. More than two years of volume growth have been given back in twelve months.
Transaction counts say nothing about price on their own. Volume is down 44% YoY and the average price per sq. ft. is down 2.4%. The two are covered separately below.
Dubai Property Sales Value
Total sales value was AED 29.4 billion in September 2026, down 45.8% YoY and up 2.9% MoM.
Year over year, value and volume fell at almost the same pace. Value fell 45.8% and transactions fell 44.4%, so the average transaction value moved only 2.5%, from about AED 2.67 million to AED 2.60 million. The annual decline is a decline in the number of deals. It is not a collapse in what each deal is worth.
Month over month, value rose while volume fell. That lifted the average transaction value 9.6%, from about AED 2.38 million to AED 2.60 million. The cause is mix:
- Apartment sales, the lowest-ticket category, fell 9.7% MoM.
- Villa and townhouse sales rose 3.9%, commercial sales rose 27.7% and plot sales rose 28.8%.
- The five highest villa prices recorded in the month add up to AED 841 million, about 2.9% of all September sales value.
A higher average ticket in September therefore reflects fewer small off-plan apartments in the mix. It does not show that like-for-like prices rose.
Average transaction value by segment
| Segment | September 2026 | September 2025 | Change |
|---|---|---|---|
| All sales | AED 2.60M | AED 2.67M | -2.5% |
| Off-plan | AED 2.13M | AED 2.42M | -12.0% |
| Secondary | AED 3.46M | AED 3.39M | +2.1% |
Calculation: sales value divided by transactions. September 2025 values are implied. The average off-plan ticket fell 12% in a year, which is consistent with launches moving toward smaller and cheaper units. The average resale ticket was stable.
Sales by price band
| Price band | All sales, Sept | Off-plan, Sept | Secondary, Sept | All sales, Q3 2026 |
|---|---|---|---|---|
| Below AED 1M | 34% | 37% | 29% | 41% |
| AED 1M to 2M | 32% | 35% | 27% | 32% |
| AED 2M to 3M | 15% | 14% | 17% | 12% |
| AED 3M to 5M | 10% | 8% | 14% | 8% |
| Above AED 5M | 8% | 6% | 12% | 7% |
Shares of transaction count. The secondary column is calculated from the other two and is approximate because the source percentages are rounded. Sub-AED 1 million deals made up 34% of September sales against 41% for Q3 as a whole. The mix moved up the price ladder as the quarter went on.
Dubai Average Price Per Square Foot
The Dubai-wide average price was AED 1,650 per sq. ft. in September 2026, down 2.0% MoM and 2.4% YoY.
| September of | All sales, AED per sq. ft. | Off-plan, AED per sq. ft. |
|---|---|---|
| 2021 | 1,022 | 1,119 |
| 2022 | 1,233 | 1,337 |
| 2023 | 1,410 | 1,475 |
| 2024 | 1,542 | 1,598 |
| 2025 | 1,695 | 1,759 |
| 2026 | 1,654 | 1,701 |
The September 2026 chart values are 1,654 and 1,701. The dashboard headlines round them to 1,650 and 1,700.
- Previous peak. September 2025 is the high point in this series. The current reading is 2.4% below it for all sales and 3.3% below it for off-plan.
- Longer view. The all-sales figure is still 62% above September 2021 and 74% above September 2014 (AED 949).
- Quarter. September’s AED 1,650 is 2.0% below the Q3 2026 average of AED 1,684, so the quarter ended weaker than it began.
- Off-plan versus the market. Off-plan averaged AED 1,700 per sq. ft., a 3% premium to the all-sales figure. A separate resale average was not supplied.
Median price per sq. ft. by property type
| Type | Primary market | vs 2025 | vs 2014 | Resale market | vs 2025 | vs 2014 |
|---|---|---|---|---|---|---|
| Apartment | AED 1,703 | -4.8% | +32.3% | AED 1,514 | +1.6% | +34.9% |
| Villa | AED 1,318 | +3.5% | +70.3% | AED 1,443 | -2.0% | +37.2% |
| Plot | AED 300 | -66.8% | +397.1% | AED 796 | +35.0% | +76.9% |
These are medians, so they will not match the Dubai-wide average above. Plot figures rest on a small number of deals and should not be read as a trend.
What this means for investors. New apartments still cost 12.5% more per sq. ft. than resale apartments, but that premium is shrinking. Primary apartment pricing fell 4.8% in a year while resale apartment pricing rose 1.6%. Buyers are paying less for a promise and slightly more for a finished, rentable unit. Villas show the reverse pattern, with primary pricing up 3.5% and resale down 2.0%, although primary villa sales are concentrated in outer communities where land is cheaper.
Off-Plan vs Secondary Market
Off-plan still accounts for most Dubai property sales, but its lead narrowed sharply in September 2026. Off-plan took 64.4% of transactions and 52.7% of value. A year earlier it took about 74% of transactions and 67% of value.
Off-Plan Property Market
Dubai recorded 7,271 off-plan transactions worth AED 15.5 billion in September 2026, down 51.8% YoY by count and 57.6% YoY by value.
- Transaction volume. 7,271 sales, down 13.0% MoM. That is about 48% below the October 2025 level of roughly 13,900.
- Sales value. AED 15.5 billion, down 4.5% MoM.
- Market share. 64.4% of transactions, 52.7% of value.
- Average price. AED 2.13 million per transaction, against about AED 2.42 million in September 2025 (calculation).
- Average price per sq. ft. AED 1,700, down 0.8% MoM and 3.2% YoY.
- Composition. Apartments were 85.5% of off-plan deals (6,218) and 61% of off-plan value. Villas and townhouses were 8.5% of deals (616) and 21% of value.
| Off-plan category | Transactions | MoM | YoY | Sales value |
|---|---|---|---|---|
| Apartments | 6,218 | -15.3% | -53.9% | AED 9.5B |
| Villas and townhouses | 616 | -5.1% | -45.9% | AED 3.2B |
| Commercial | 331 | +25.9% | +28.8% | AED 1.6B |
| Plots | 99 | +10.0% | -47.6% | AED 1.2B |
Off-plan commercial is the one category growing on both measures. Off-plan apartments, the engine of the 2024 and 2025 volume boom, have lost more than half their sales in a year.
Project launches and investor demand. Demand is concentrated in a small number of launches. The five best-selling off-plan apartment projects sold 1,060 units between them, 17% of all off-plan apartment sales. Four of the five have median prices between AED 570,000 and AED 840,500. Off-plan demand in September was mostly a sub-AED 1 million investor product.
Developer incentives and payment plans. Incentive and payment plan terms were not part of the dataset, so this report does not quantify them. Our interpretation is that when off-plan volume halves and headline price per sq. ft. slips only 3.2%, the adjustment is happening in the terms. Longer post-handover plans, fee waivers and guaranteed returns reduce the effective price without changing the registered one. Buyers should compare offers on net effective price.
Potential risks.
- Resale liquidity for off-plan units depends on the next buyer. With off-plan volume down 52%, there are fewer of them.
- Delivery. The Q3 2026 dashboard shows 65% of units due for handover as delivered and 35% as overdue.
- Absorption. Roughly 129,000 off-plan sales were registered in the twelve months to September 2026 (chart estimate). Each one is a unit that has to be completed, handed over and either occupied or let.
Secondary Property Market
The secondary market recorded 4,017 transactions worth AED 13.9 billion in September 2026, about 23% below September 2025 and roughly 10% above August 2026. All secondary figures are calculations.
- Transaction volume. 4,017 sales, 35.6% of the market.
- Sales value. AED 13.9 billion, 47.3% of the market. Value was about 21% lower YoY and about 13% higher MoM.
- Average price. AED 3.46 million per transaction, 62% higher than the off-plan average.
- Price per sq. ft. Median resale apartment AED 1,514 (+1.6% vs 2025). Median resale villa AED 1,443 (-2.0%).
- Composition. Apartments 2,837 deals (71%), villas and townhouses 812 (20%), commercial 208, plots 138.
| Secondary category | Transactions | MoM | YoY | Sales value | Average price |
|---|---|---|---|---|---|
| Apartments | 2,837 | +6% | -25% | AED 5.3B | AED 1.87M |
| Villas and townhouses | 812 | +12% | -17% | AED 5.4B | AED 6.65M |
| Commercial | 208 | +31% | -18% | AED 0.6B | AED 2.88M |
| Plots | 138 | +47% | -27% | AED 2.6B | AED 18.8M |
Calculated as total minus off-plan in each category. Percentage changes are approximate because they are derived from two rounded series.
Ready property demand. Resale villas and townhouses generated more value than resale apartments, AED 5.4 billion against AED 5.3 billion, from under a third of the deal count.
Mortgage-driven purchases. 32% of resale purchases were financed and 68% were cash. Mortgage registrations rose 6.5% YoY while resale transactions fell about 23%. Financed buyers are a growing share of a smaller market.
Investor exits. The data does not identify seller type. A resale market that grows 10% in a month when off-plan falls 13% is consistent with buyers choosing completed stock over launches. It is also consistent with more off-plan investors listing at handover. Both can be true at once.
Rental income considerations. Ready property earns rent from day one, but rents are falling. That is covered in the rental section.
Off-plan and secondary compared
| Metric | Off-Plan | Secondary |
|---|---|---|
| Transactions | 7,271 | 4,017 |
| Share of transactions | 64.4% | 35.6% |
| Sales value | AED 15.5B | AED 13.9B |
| Share of value | 52.7% | 47.3% |
| Average price | AED 2.13M | AED 3.46M |
| Transactions, YoY | -51.8% | -23% |
| Transactions, MoM | -13.0% | +10% |
| Sales value, YoY | -57.6% | -21% |
| Average price per sq. ft. | AED 1,700 | Not supplied |
| Median apartment price per sq. ft. | AED 1,703 | AED 1,514 |
| Median villa price per sq. ft. | AED 1,318 | AED 1,443 |
| Apartment share of deals | 85.5% | 70.6% |
| Share of deals above AED 5M | 6% | 12% |
Which segment suits which buyer
- End users and yield buyers. Resale. The apartment discount to new stock is 12.5% per sq. ft., the unit exists, and the rent can be checked against real contracts.
- Capital growth investors. Selected off-plan only. The case now has to rest on a specific location and developer, because the tide that lifted every launch in 2024 and 2025 has gone out.
- Short-horizon flippers. Neither. Assignment profits need a rising launch market and September’s data shows the opposite.
- Family buyers. Resale villas and townhouses. This is the most liquid part of the ready market by value and the one where buyers have the most completed stock to inspect.
Apartment Market Analysis
Apartments accounted for 9,055 sales worth AED 14.8 billion in September 2026, which is 80.2% of all transactions and 50.3% of all value. Apartment sales fell 9.7% MoM and 47.6% YoY, the steepest annual decline of any category.
| Apartment metric | Total | Off-plan | Secondary |
|---|---|---|---|
| Transactions | 9,055 | 6,218 | 2,837 |
| Share of apartment deals | 100% | 68.7% | 31.3% |
| Sales value | AED 14.8B | AED 9.5B | AED 5.3B |
| Average selling price | AED 1.63M | AED 1.53M | AED 1.87M |
| Median price per sq. ft. | Not supplied | AED 1,703 | AED 1,514 |
| Transactions, YoY | -47.6% | -53.9% | -25% |
| Transactions, MoM | -9.7% | -15.3% | +6% |
Secondary figures and average prices are calculations.
The average resale apartment sold for AED 1.87 million against AED 1.53 million off-plan, yet resale is cheaper per sq. ft. That combination implies resale apartments are larger on average, and that off-plan sales are weighted to small units priced to a ticket.
Best-selling apartment projects, September 2026
| Segment | Project | Sales | Value | Median price |
|---|---|---|---|---|
| Off-plan | Valia – Tower | 263 | AED 725.4M | AED 2.3M |
| Off-plan | Binghatti Skyterraces | 252 | AED 238.3M | AED 840.5K |
| Off-plan | Binghatti Skyflame 1 | 226 | AED 162.7M | AED 570K |
| Off-plan | Raw District 2 By Imtiaz – Residential | 186 | AED 184.7M | AED 751.2K |
| Off-plan | Binghatti Skyflame 2 | 133 | AED 104.8M | AED 580K |
| Resale | Dune Residency Dubai | 32 | AED 24.0M | AED 651.2K |
| Resale | Binghatti Apex | 31 | AED 24.0M | AED 680K |
| Resale | Regalia | 20 | AED 28.7M | AED 1.3M |
| Resale | Sobha Hartland – Crest Grande | 19 | AED 51.3M | AED 2.5M |
| Resale | Peninsula Four Tower A | 15 | AED 28.8M | AED 1.4M |
- Concentration. The top five off-plan projects sold 1,060 units. The top five resale buildings sold 117. Off-plan volume depends on a handful of launches. Resale volume is spread across hundreds of buildings.
- One developer, three projects. Binghatti’s three projects sold 611 units, close to 10% of all off-plan apartment sales in Dubai for the month.
- Launch effect. Valia – Tower recorded 263 of its 324 Q3 sales in September. One launch added AED 725 million to the month.
Demand by unit size
Bedroom-level data (studio, one-bedroom, two-bedroom) was not supplied, so this report does not state shares by unit type. Price bands are the closest proxy. Across all property types, 34% of September deals were below AED 1 million and 32% were between AED 1 million and AED 2 million. In off-plan the two bands together reached 72%.
Luxury apartments. The highest apartment price recorded in September was AED 71 million at Como Residences on Palm Jumeirah. Four more sold between AED 30 million and AED 37 million. See the luxury section.
Who is buying. Our interpretation is that two distinct buyers are active. The first is the ticket-driven investor taking sub-AED 1 million off-plan units on payment plans. This group has shrunk by more than half in a year. The second is the resale buyer, more often financed, paying AED 1.5 million to AED 2.5 million for a larger completed unit. This group is down about a quarter and grew in September.
Villa and Townhouse Market Analysis
Villas and townhouses accounted for 1,428 sales worth AED 8.6 billion in September 2026. That is 12.7% of transactions and 29.3% of value. Sales rose 3.9% MoM and fell 32.7% YoY, a smaller annual decline than apartments.
| Villa and townhouse metric | Total | Off-plan | Secondary |
|---|---|---|---|
| Transactions | 1,428 | 616 | 812 |
| Share of villa deals | 100% | 43.1% | 56.9% |
| Sales value | AED 8.6B | AED 3.2B | AED 5.4B |
| Average selling price | AED 6.02M | AED 5.19M | AED 6.65M |
| Median price per sq. ft. | Not supplied | AED 1,318 | AED 1,443 |
| Transactions, YoY | -32.7% | -45.9% | -17% |
| Transactions, MoM | +3.9% | -5.1% | +12% |
This is the only major residential category where resale outsells off-plan. Resale villas and townhouses fell about 17% YoY, the most resilient residential line in the dataset.
Best-selling villa and townhouse projects, September 2026
| Segment | Project | Sales | Value | Median price |
|---|---|---|---|---|
| Off-plan | Greenz By Danube | 62 | AED 305.0M | AED 4.5M |
| Off-plan | Reportage Hills | 53 | AED 102.8M | AED 1.7M |
| Off-plan | The Greens At Sobha Sanctuary | 51 | AED 258.6M | AED 4.2M |
| Off-plan | The Grove At Sobha Sanctuary | 33 | AED 332.1M | AED 9.5M |
| Off-plan | The Brooks At Sobha Sanctuary | 29 | AED 166.4M | AED 5.8M |
| Resale | Damac Lagoons – Portofino | 16 | AED 49.6M | AED 2.6M |
| Resale | Mudon Al Ranim 6 | 16 | AED 62.9M | AED 4.0M |
| Resale | Mudon Al Ranim 5 | 16 | AED 65.3M | AED 4.1M |
| Resale | The Valley – Elora | 13 | AED 40.2M | AED 3.3M |
| Resale | Damac Lagoons – Costa Brava (2) | 12 | AED 37.4M | AED 2.7M |
- Off-plan villa supply is concentrated too. The top five projects made up 228 of 616 off-plan villa sales, or 37%. Three phases of Sobha Sanctuary alone sold 113 homes for AED 757 million.
- Resale demand sits at AED 2.6 million to AED 4.1 million. Every one of the five most-traded resale villa communities has a median in that range. That is the family end-user bracket.
- Supply constraints. No supply data was supplied. What the data does show is that buyers who want a completed villa are transacting at similar prices to a year ago (median per sq. ft. -2.0%) on volumes that have held better than any other segment.
Are villas still outperforming apartments?
Over the long run, yes. Over the last twelve months the picture is mixed, and the data does not support a blanket claim.
| Median price per sq. ft. | vs 2025 | vs 2014 |
|---|---|---|
| Primary villas | +3.5% | +70.3% |
| Primary apartments | -4.8% | +32.3% |
| Resale villas | -2.0% | +37.2% |
| Resale apartments | +1.6% | +34.9% |
New villas have outperformed new apartments over both periods. In the resale market, apartments edged ahead of villas over the past year. Villa rents fell 14.6% YoY against 4.1% for apartments, so villa owners have lost more income than apartment owners even where capital values held.
Top Performing Dubai Areas
Dubai South recorded the most property sales of any area in September 2026, with about 820 transactions, followed closely by Al Barsha South Fourth with about 800.
The DLD registers sales under official area names. Where this report gives a familiar community name in brackets, that mapping is ours. Area counts are read from bar charts and rounded to the nearest 10.
Highest Transaction Volume
| Rank | Area | All sales | Off-plan | Secondary | Off-plan share |
|---|---|---|---|---|---|
| 1 | Dubai South | 820 | 740 | 80 | 90% |
| 2 | Al Barsha South Fourth (Jumeirah Village Circle) | 800 | 440 | 360 | 55% |
| 3 | Wadi Al Safa 3 (Dubailand) | 650 | 560 | 90 | 86% |
| 4 | Jabal Ali First | 540 | 390 | 150 | 72% |
| 5 | Wadi Al Safa 5 (Dubailand) | 460 | Not in top 5 | Not available | Not available |
The top five areas produced about 3,270 sales, 29% of the Dubai total.
Most Active Off-Plan Communities
| Rank | Area | Off-plan sales | Share of Dubai off-plan |
|---|---|---|---|
| 1 | Dubai South | 740 | 10% |
| 2 | Wadi Al Safa 3 (Dubailand) | 560 | 8% |
| 3 | Al Barsha South Fourth (Jumeirah Village Circle) | 440 | 6% |
| 4 | Jabal Ali First | 390 | 5% |
| 5 | Al Hebiah First | 360 | 5% |
Five areas took 34% of all off-plan sales. All five are inland or southern growth corridors.
Most Active Secondary Communities
A full resale ranking by area was not supplied. Among the four areas where both totals are available, Al Barsha South Fourth is by far the most liquid resale market at roughly 360 sales, followed by Jabal Ali First at about 150. Dubai South and Wadi Al Safa 3 each recorded fewer than 100 resales despite leading on total volume.
That gap matters. An area with 740 off-plan sales and 80 resales in a month has not yet been tested as an exit market.
Highest Price Per Square Foot
Area-level prices were supplied for Q3 2026, for the ten highest-volume areas in each property type. They are quarterly averages and they are not September figures.
Apartments, Q3 2026
| Area | Average price | Average price per sq. ft. |
|---|---|---|
| Marsa Dubai (Dubai Marina, JBR, Bluewaters) | AED 2,449,548 | AED 2,256 |
| Business Bay | AED 1,650,000 | AED 2,064 |
| Jebel Ali | AED 738,334 | AED 1,759 |
| Wadi Al Safa 4 | AED 624,000 | AED 1,719 |
| Dubai South | AED 728,000 | AED 1,709 |
| Jabal Ali Industrial Second | AED 597,400 | AED 1,585 |
| Jabal Ali First | AED 1,467,625 | AED 1,580 |
| Wadi Al Safa 3 | AED 740,999 | AED 1,421 |
| Al Barsha South Fourth | AED 950,000 | AED 1,399 |
| Wadi Al Safa 5 | AED 890,000 | AED 1,389 |
Villas and townhouses, Q3 2026
| Area | Average price | Average price per sq. ft. |
|---|---|---|
| Me’Aisem First | AED 14,650,000 | AED 2,278 |
| Al Hebiah Fourth | AED 10,800,000 | AED 2,054 |
| Jabal Ali First | AED 5,165,000 | AED 1,698 |
| Al Yufrah 1 | AED 5,690,155 | AED 1,675 |
| Wadi Al Safa 5 | AED 6,500,000 | AED 1,566 |
| Al Rowaiyah First | AED 4,362,000 | AED 1,491 |
| Al Yelayiss 1 | AED 3,087,000 | AED 1,301 |
| Dubai South | AED 4,950,000 | AED 1,272 |
| Al Hebiah Fifth | AED 2,705,001 | AED 1,211 |
| Madinat Hind 4 | AED 1,720,000 | AED 832 |
A low ticket is not a low price. Dubai South apartments average AED 728,000, less than a third of the Marsa Dubai average. Per sq. ft. they cost AED 1,709, only 24% below Marsa Dubai and 22% above Al Barsha South Fourth. Buyers in the cheapest-ticket areas are paying mid-market rates for small units.
Highest Transaction Value and Strongest Price Growth
The dataset did not include area rankings by sales value or by price change, so this report does not publish them.
Q3 2026 for comparison
| Rank | Area | Q3 2026 sales | September sales | September share of Q3 |
|---|---|---|---|---|
| 1 | Dubai South | 5,210 | 820 | 16% |
| 2 | Al Barsha South Fourth | 2,540 | 800 | 32% |
| 3 | Wadi Al Safa 4 | 1,980 | Not in top 5 | Not available |
| 4 | Jabal Ali First | 1,540 | 540 | 35% |
| 5 | Wadi Al Safa 3 | 1,520 | 650 | 43% |
Dubai South sold about 4,390 units across July and August and about 820 in September. A month is roughly a third of a quarter, so its September run rate was less than half its July and August pace. The area’s Q3 lead came from launch activity earlier in the quarter. Al Barsha South Fourth and Jabal Ali First ran at a steady third of their quarterly totals.
Community notes
| Area | What is driving demand | Typical buyer | Price positioning | Investment thesis | Main risk |
|---|---|---|---|---|---|
| Dubai South | Launch volume and the Al Maktoum International Airport expansion | Off-plan investor | AED 728K average apartment, AED 1,709 per sq. ft. | Long-horizon infrastructure play | 90% off-plan, thin resale market, pace dropped sharply in September |
| Al Barsha South Fourth (JVC) | Established rental community with both new and resale stock | Mixed investor and end user | AED 950K average apartment, AED 1,399 per sq. ft. | Liquidity. The deepest resale market among the top areas | Continuous new supply competes with existing landlords |
| Wadi Al Safa 3 (Dubailand) | Large off-plan launches | Off-plan investor | AED 741K average apartment, AED 1,421 per sq. ft. | Low entry ticket | 86% off-plan, exit market untested |
| Jabal Ali First | Balanced apartment and villa demand | End user and investor | AED 1.47M average apartment, AED 5.17M average villa | Appears in the top ten for both apartments and villas | Mid-market pricing leaves less margin if rents keep falling |
| Wadi Al Safa 5 (Dubailand) | Villa and townhouse demand | Family end user | AED 6.5M average villa, AED 1,566 per sq. ft. | Family housing with resale depth | Villa rents down 14.6% YoY citywide |
| Marsa Dubai | Waterfront and prime apartment demand | Lifestyle buyer, international investor | AED 2.45M average apartment, AED 2,256 per sq. ft. | Scarce waterfront land, deep tenant pool | Highest price per sq. ft. among volume areas, lower yield |
| Business Bay | Central location close to Downtown and DIFC | Investor, professional end user | AED 1.65M average apartment, AED 2,064 per sq. ft. | Central rental demand | Dense tower supply |
The demand drivers, buyer profiles and theses in this table are Totality Real Estate interpretations. The prices and off-plan shares are data.
Price per sq. ft. measures prestige and scarcity. It does not measure return. The areas at the top of the price table are not automatically the better investments, and several of the lowest-ticket areas are also the ones most dependent on off-plan investors.
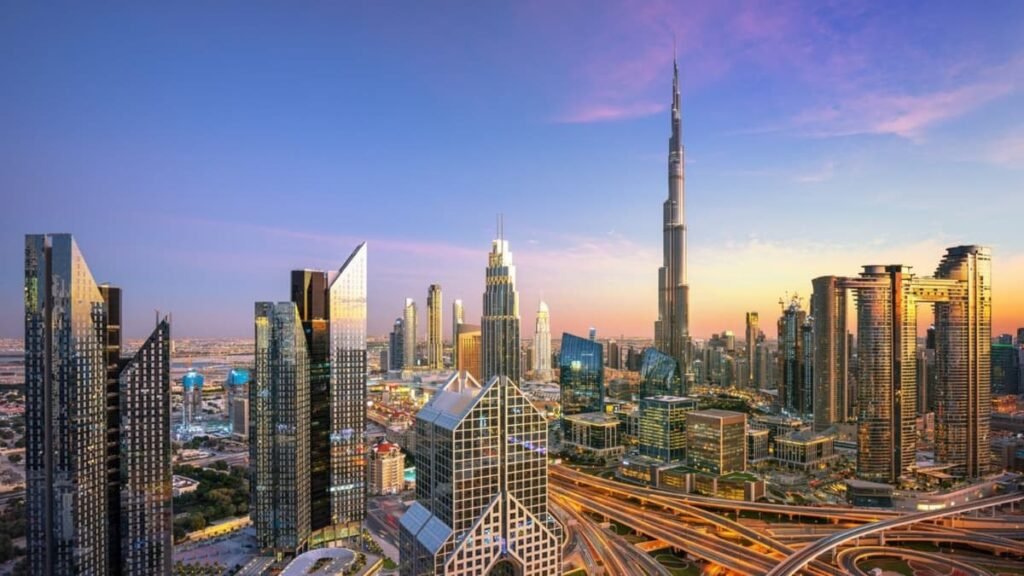
Dubai Luxury Property Market
Luxury sales held up better than the wider market in September 2026. Properties above AED 5 million made up 8% of transactions, roughly 900 deals, against 7% for Q3 2026 as a whole.
What the price bands show
| Band | Share of September deals | Approximate count |
|---|---|---|
| Above AED 5M, all sales | 8% | 900 |
| Above AED 5M, off-plan | 6% | 440 |
| Above AED 5M, secondary | 12% | 470 |
| AED 3M to 5M, all sales | 10% | 1,130 |
Counts are calculated from rounded percentages. The dataset stops at “above AED 5 million”. Transaction counts for AED 10 million, AED 20 million, AED 50 million and AED 100 million and above were not supplied and are not estimated here.
About one resale transaction in eight was above AED 5 million. In off-plan it was about one in seventeen. High-value buyers are transacting mainly in completed property.
Highest-priced sales, September 2026
| Rank | Apartments | Price | Villas | Price |
|---|---|---|---|---|
| 1 | Como Residences, Palm Jumeirah | AED 71M | Eome, Palm Jumeirah | AED 260M |
| 2 | Muraba Veil, Al Wasl | AED 37M | Dubai Hills – Hills View Community | AED 252M |
| 3 | Mr C Residences Jumeirah – Block B3, Jumeirah Second | AED 37M | Emirates Hills | AED 128M |
| 4 | Bluewaters Residences 3, Marsa Dubai | AED 36M | Signature Villas | AED 110M |
| 5 | Serenia Living – Tower 3, Palm Jumeirah | AED 30M | Lanai Island | AED 91M |
Prices are the top recorded sale in each project or community, as listed by the source.
- Villas. Four sales above AED 100 million in a single month, two of them above AED 250 million. The five top villa prices total AED 841 million.
- Waterfront. Four of the five top apartment sales are on Palm Jumeirah, Bluewaters or the Jumeirah coastline. The top villa sale is on Palm Jumeirah.
- Branded residences. Como Residences and Mr C Residences are both hotel-branded. Branded stock took two of the top three apartment positions.
- Penthouses. The source does not identify unit type, so penthouse sales cannot be confirmed from this data.
For the full quarter, the highest apartment prices were AED 166 million at Aman Residences Tower 2 (Jumeirah Second), AED 90 million at Passo By Beyond – Tower B (Palm Jumeirah) and AED 86 million at The Address JBR 2 (Marsa Dubai). The three highest villa prices of Q3 were all recorded in September.
International HNWI demand, supply scarcity and cash buyers. Buyer nationality and payment method by price band were not supplied. What can be said from the data is narrower. Ultra-prime deals continued at record-scale prices in a month when total volume fell 44% YoY, and they clustered in locations where new land cannot be created. Our interpretation is that this segment is driven by wealth and scarcity, and is largely disconnected from the off-plan investor cycle.
A small number of very large sales does not make a trend. Five villa deals moved 2.9% of the month’s value.
Mortgage Market and Cash Buyers
Dubai recorded 4,038 mortgage registrations worth AED 16.2 billion in September 2026, up 6.5% YoY by count and 37.6% YoY by value.
| Mortgage metric | September 2026 | MoM | YoY | Q3 2026 | Q3 vs Q3 2025 |
|---|---|---|---|---|---|
| Registrations | 4,038 | +7.2% | +6.5% | 12,311 | -7.8% |
| Value | AED 16.2B | +12.7% | +37.6% | AED 48.5B | -0.8% |
| Average per registration | AED 4.01M | +5% | +29% | AED 3.94M | +8% |
Averages are calculations.
- Cash versus financed. 68% of resale purchases were cash and 32% were mortgaged in September. For Q3 the split was 67% and 33%. The source excludes refinancing and primary market registrations from this split.
- End-user demand. Mortgage registrations rose while sales fell 44%. Financed buyers are overwhelmingly buying completed homes, so this supports the reading that end-user demand is steadier than investor demand.
- September against the quarter. Q3 registrations were 7.8% below Q3 2025, yet September was 6.5% above September 2025. Financing activity strengthened as the quarter ended.
- Bigger loans. The average registration rose about 29% YoY to roughly AED 4.0 million. Financed activity has shifted toward higher-value property. This average includes all registered mortgages and can be pulled up by a few large commercial or portfolio loans.
- Investor leverage. Dubai remains a cash-led market. Two in three resale buyers used no mortgage, which limits forced selling when rates or values move.
One caution on the numbers. The 4,038 figure counts mortgage registrations. It is not the number of financed purchases, and it should not be divided by sales to produce a “mortgage share”.
Interest-rate implications. No rate data was supplied. The UAE dirham is pegged to the US dollar, so local mortgage rates follow US policy rates. Lower rates would support the resale market first, since that is where financed buyers are. Higher rates would be felt most by end users in the AED 2 million to AED 5 million bracket.
Rental Market
Average annual rents fell across all three property types in September 2026. Apartment rents averaged AED 70,000, down 4.1% YoY. Villa rents averaged AED 205,000, down 14.6% YoY.
| Property type | Average annual rent, Sept 2026 | Implied Sept 2025 | YoY |
|---|---|---|---|
| Apartment | AED 70,000 | AED 73,000 | -4.1% |
| Villa | AED 205,000 | AED 240,000 | -14.6% |
| Commercial | AED 115,500 | AED 138,500 | -16.6% |
Rents against prices
| Segment | Rent, YoY | Median resale price per sq. ft., YoY | Effect on gross yield |
|---|---|---|---|
| Apartments | -4.1% | +1.6% | Compressing |
| Villas | -14.6% | -2.0% | Compressing faster |
Rents are falling faster than resale prices in both segments. Gross yields on existing stock are therefore lower than a year ago, and the squeeze is larger on villas.
Gross yields
Community-level rents were not supplied, so community-level yields cannot be calculated from this data. A market-wide indication is possible:
- Apartments: AED 70,000 average rent against an average resale apartment price of AED 1.87 million gives about 3.7% gross.
- Villas: AED 205,000 average rent against an average resale villa price of AED 6.65 million gives about 3.1% gross.
These are rough. The rent average and the sale average come from different baskets of property, and the sale average is pulled up by luxury deals. Mid-market units yield more than this. The figures are useful for direction, and should not be used to underwrite a purchase.
Totality Real Estate’s working assumptions for gross yield in selected areas, as of September 2026, are 7% to 10% in Dubai Islands, 6% to 8% in Dubai Maritime City, about 8% in Dubai South and about 7% in Al Jaddaf. These are house views. They are not derived from the September dataset.
Gross yield is not net yield
Gross yield is annual rent divided by purchase price. Net yield is what remains after costs. An illustration, using assumed figures:
| Item | Amount |
|---|---|
| Purchase price | AED 1,000,000 |
| Annual rent | AED 75,000 |
| Gross yield | 7.5% |
| Service charges (700 sq. ft. at AED 15) | -AED 10,500 |
| Vacancy allowance (5%) | -AED 3,750 |
| Management fee (5%) | -AED 3,750 |
| Maintenance | -AED 2,000 |
| Net income | AED 55,000 |
| Net yield | 5.5% |
Two percentage points disappear between gross and net in this example, before furnishing costs, purchase costs and any mortgage interest. Service charges vary widely by building and are the largest single difference between two units with the same gross yield.
Short-term and long-term rental. No short-term rental data was supplied. In a market where long-term rents are falling, short-term income projections in sales brochures deserve more scrutiny, not less. They depend on occupancy and nightly rates that are not guaranteed, and they carry higher furnishing and management costs.
Best Areas to Invest in Dubai, September 2026
There is no single best area to invest in Dubai in September 2026. The data points to different areas for different objectives, and for some objectives it does not point anywhere with confidence.
The rankings below use only the areas and figures in this dataset. Rental yield, supply pipeline and price growth by area were not supplied, so those criteria are assessed qualitatively and marked as interpretation. Nothing here is a guarantee or a personal recommendation.
Best for Capital Appreciation
The data does not rank areas by price growth. It does show which segment is holding value: completed villas and townhouses, where volumes fell least and pricing moved 2.0%.
- Established villa communities with active resale. Mudon Al Ranim, Damac Lagoons and The Valley each recorded 12 to 16 resales in September at medians of AED 2.6 million to AED 4.1 million. Demand is proven and repeat.
- Jabal Ali First. The only area in the Q3 top ten for both apartments and villas, with 28% of September sales in resale.
Best for Rental Yield
Yield is rent over price, so the lowest prices per sq. ft. in liquid areas are the starting point.
- Al Barsha South Fourth (JVC). AED 1,399 per sq. ft., the second lowest among the ten apartment areas, with the deepest resale and rental market.
- Wadi Al Safa 5 and Wadi Al Safa 3. AED 1,389 and AED 1,421 per sq. ft.
- Dubai South. Totality’s working assumption is about 8% gross, but at AED 1,709 per sq. ft. the entry price is no longer low.
Apartment rents are down 4.1% YoY. Underwrite on current achieved rents, not on last year’s asking rents.
Best for Luxury Investment
- Palm Jumeirah. The top apartment sale and the top villa sale of the month.
- Jumeirah Second. Mr C Residences at AED 37 million in September and Aman Residences at AED 166 million in Q3.
- Marsa Dubai, including Bluewaters. AED 36 million top sale and the highest average price per sq. ft. of any volume area.
- Emirates Hills and Dubai Hills. Villa sales of AED 128 million and AED 252 million.
These are stores of wealth. They trade on scarcity and should not be bought for yield.
Best for Long-Term Growth
- Dubai South. The leading area by volume in both September and Q3, tied to the airport expansion. The horizon is long and the resale market is thin today.
- Dubailand (Wadi Al Safa 3 and 5). Large land bank, family housing, volumes in the top five.
Best for Lower Entry Prices
| Area | Average apartment price, Q3 2026 | Price per sq. ft. |
|---|---|---|
| Jabal Ali Industrial Second | AED 597,400 | AED 1,585 |
| Wadi Al Safa 4 | AED 624,000 | AED 1,719 |
| Dubai South | AED 728,000 | AED 1,709 |
| Jebel Ali | AED 738,334 | AED 1,759 |
| Wadi Al Safa 3 | AED 740,999 | AED 1,421 |
All five of the cheapest areas by ticket cost more per sq. ft. than JVC. A low entry price here buys a small unit. Compare on price per sq. ft. and on service charges before comparing on ticket.
Best Waterfront Opportunities
- Marsa Dubai. The established coastal market among the ten highest-volume apartment areas. AED 2.45 million average, AED 2,256 per sq. ft.
- Palm Jumeirah. Ultra-prime only at these prices.
- Dubai Islands and Dubai Maritime City. Neither appears in the September top-area lists, so there is no September transaction data to cite. Totality’s working yield assumptions are 7% to 10% and 6% to 8% gross respectively. Both are emerging waterfront districts where pricing is still below the established coast.
Key Infrastructure and Market Catalysts
The catalysts that matter most to the areas in this data are airport and transport projects in the south and east of the city. This section is context from public announcements. It is not part of the September dataset and each item should be linked to an official source before publication.
| Catalyst | Areas affected | Why it matters to the thesis |
|---|---|---|
| Al Maktoum International Airport expansion | Dubai South, Jebel Ali | The main driver cited for Dubai South demand. Returns depend on the timing of the airport’s phased opening |
| Dubai Metro Blue Line | Dubai Creek Harbour, Academic City, Dubai Silicon Oasis, International City | Rail access tends to support rents before it supports prices. Announced completion is 2029 |
| Existing Metro Route 2020 | Jabal Ali First | Already operating, which helps explain balanced end-user demand |
| Palm Jebel Ali | Jebel Ali coast | Adds a large volume of future waterfront villa supply |
| Dubai Islands | Deira coast | New beachfront apartment district with a growing delivery pipeline |
| Population growth and business migration | All mid-market rental areas | The demand side of the supply question. Not measured in this dataset |
| Golden Visa | Purchases of AED 2 million and above | Supports the AED 2 million to AED 3 million band, 15% of September deals |
A catalyst is priced in once everyone knows about it. Dubai South apartments already trade at AED 1,709 per sq. ft. The question for a buyer is how much of the airport story is in that number.
Supply Pipeline and Oversupply Risk
Dubai is not one market. In September 2026 some segments show the signs of oversupply while others show scarcity.
No unit-level supply forecast was supplied, so this report does not publish a number for expected completions. Three things in the data act as proxies.
- Units sold but not yet delivered. Roughly 129,000 off-plan sales were registered in the twelve months to September 2026. This is a floor for stock that has to be absorbed over the coming years.
- Delivery performance. The Q3 2026 dashboard shows 65% of units due for handover as delivered and 35% as overdue. Delays push supply later. They do not remove it.
- Rents. Apartment rents are down 4.1% YoY and villa rents 14.6%. Falling rents are the first place new supply shows up.
Where supply is concentrated
| Area | September off-plan sales | Off-plan share of area sales |
|---|---|---|
| Dubai South | 740 | 90% |
| Wadi Al Safa 3 | 560 | 86% |
| Al Barsha South Fourth | 440 | 55% |
| Jabal Ali First | 390 | 72% |
| Al Hebiah First | 360 | Not available |
These five areas took 34% of September’s off-plan sales.
Where the pressure is likely to fall
Higher risk of oversupply (interpretation):
- Small apartments below AED 1 million in the high-volume off-plan corridors. This is the single largest block of sales, 37% of off-plan deals, and it is the product type the best-selling launches keep adding.
- Areas where off-plan is 85% or more of sales. They have not yet shown that an exit market exists at launch prices.
- Off-plan apartments generally. Median primary apartment pricing is already down 4.8% YoY.
More likely to remain supply constrained (interpretation):
- Completed villas and townhouses in established communities. Volumes fell least here.
- Prime waterfront. The ultra-prime deals of September are in locations with no new land.
- Larger resale apartments in central and coastal areas. Resale apartment pricing rose 1.6% YoY against the trend.
The same city can have falling rents on studios in one corridor and a AED 260 million villa sale in another in the same month. September 2026 had both.
Investor Risks
The main risk in the Dubai property market in September 2026 is buying off-plan at a launch price that the resale market will not support at handover.
| Risk | What the September data shows | How to reduce it |
|---|---|---|
| Excessive off-plan supply | About 129,000 off-plan sales in twelve months. Rents falling | Favour segments with resale depth. Check the delivery pipeline within a two-kilometre radius |
| Overpaying at launch | Primary apartments cost 12.5% more per sq. ft. than resale. Primary pricing down 4.8% YoY | Compare every launch with completed stock in the same area on net effective price |
| Developer risk | Volume concentrated in a few developers. One had three of the top five apartment projects | Review delivery record, escrow status and construction progress |
| Construction delays | 35% of units due for handover are overdue (Q3 2026) | Build a delay into the cash flow. Read the SPA compensation clauses |
| Aggressive payment plans | Not measured. Likely where competition is happening | Model the full payment schedule. Treat post-handover plans as debt |
| Service charges | Not measured | Obtain the approved service charge before committing. Use net yield |
| Rental assumptions | Apartment rents -4.1% YoY, villas -14.6% | Underwrite on registered contracts in the building, minus a margin |
| Interest-rate sensitivity | 32% of resale purchases are financed. Average registration AED 4.0M | Stress test repayments at a higher rate |
| Market liquidity | Total sales down 44% YoY. Off-plan down 52% | Assume a longer selling period. Avoid plans that rely on assignment before handover |
| Short-term speculation | Off-plan share falling from about 74% to 64% in a year | Do not rely on a rising launch market for the exit |
| Global economic conditions | Not measured | Hold liquidity outside the property |
| Currency exposure | The dirham is pegged to the US dollar | Non-dollar investors carry dollar risk on price and rent |
Professional due diligence reduces these risks by replacing brochure assumptions with evidence: comparable transactions, registered rents, the developer’s delivery history, the service charge schedule and a realistic exit price. It does not remove market risk.
September 2026 vs September 2025
Compared with September 2025, Dubai recorded 44.4% fewer property transactions, 45.8% less sales value and a 2.4% lower average price per sq. ft. in September 2026.
| Metric | September 2026 | September 2025 | YoY |
|---|---|---|---|
| Total transactions | 11,288 | 20,300 | -44.4% |
| Total sales value | AED 29.4B | AED 54.2B | -45.8% |
| Average price per sq. ft. | AED 1,650 | AED 1,691 | -2.4% |
| Off-plan transactions | 7,271 | 15,090 | -51.8% |
| Off-plan sales value | AED 15.5B | AED 36.6B | -57.6% |
| Off-plan price per sq. ft. | AED 1,700 | AED 1,756 | -3.2% |
| Off-plan share of transactions | 64.4% | 74.3% | -9.9 pts |
| Off-plan share of value | 52.7% | 67.4% | -14.7 pts |
| Secondary transactions | 4,017 | 5,220 | -23% |
| Secondary sales value | AED 13.9B | AED 17.7B | -21% |
| Apartment transactions | 9,055 | 17,280 | -47.6% |
| Villa and townhouse transactions | 1,428 | 2,120 | -32.7% |
| Commercial transactions | 539 | 510 | +5.3% |
| Plot transactions | 237 | 375 | -37.1% |
| Mortgage registrations | 4,038 | 3,790 | +6.5% |
| Mortgage value | AED 16.2B | AED 11.8B | +37.6% |
| Average apartment rent | AED 70,000 | AED 73,000 | -4.1% |
| Average villa rent | AED 205,000 | AED 240,000 | -14.6% |
September 2025 values are implied from the published YoY changes. Secondary figures are calculations.
The biggest changes, in order of size:
- Off-plan value, -57.6%. About AED 21 billion less off-plan property was sold than in September 2025.
- Off-plan transactions, -51.8%. Roughly 7,800 fewer deals. Off-plan explains about 87% of the total fall in transaction count.
- Apartments, -47.6%. Roughly 8,200 fewer sales, most of them off-plan.
- Mortgage value, +37.6%. The one large number moving the other way.
- Villas and townhouses, -32.7%. A smaller fall, and resale villas fell only about 17%.
- Secondary market, about -23%. Down, but by less than half the off-plan rate.
- Price per sq. ft., -2.4%. Small in comparison with everything above.
- Luxury. A YoY comparison for the luxury segment was not supplied.
January to September 2026 Year-to-Date Performance
Dubai recorded an estimated 121,000 to 124,000 property transactions in the first nine months of 2026, an average of about 13,700 a month.
The YTD total is an estimate because Q1 2026 was supplied only in chart form. Q2 and Q3 are firm.
| Period | Transactions | Sales value | Basis |
|---|---|---|---|
| Q1 2026 | 45,000 to 48,000 | Not supplied | Read from charts |
| Q2 2026 | 38,270 | AED 110.3B | Implied from Q3 QoQ changes |
| Q3 2026 | 37,429 | AED 92.9B | As published |
| YTD 2026 | 121,000 to 124,000 | Not available | Estimate |
| Q2 and Q3 combined | 75,700 | AED 203.2B | Calculation |
- Average monthly transactions, YTD: about 13,700 at the upper estimate.
- Average monthly sales value, April to September: AED 33.9 billion. A nine-month value figure cannot be calculated without Q1.
- September against the YTD average: 11,288 is about 18% below it.
- Off-plan share, YTD: about 71% of transactions, against 64.4% in September.
2026 against 2025
The quarterly chart supplied compares 2026 with 2025 on a consistent basis.
| Quarter | 2026 vs 2025, transactions |
|---|---|
| Q1 | about +4% |
| Q2 | about -28% |
| Q3 | -36.9% |
| YTD | about -22% |
2026 began ahead of 2025. The market turned in Q2 and the gap has widened each quarter since. A reader looking only at the YTD figure of about -22% would underestimate the current rate of decline, which is closer to -37% for the quarter and -44% for September.
Q3 2026 in brief
| Metric | Q3 2026 | QoQ | YoY |
|---|---|---|---|
| Transactions | 37,429 | -2.2% | -36.9% |
| Sales value | AED 92.9B | -15.8% | -45.5% |
| Average price per sq. ft. | AED 1,684 | -1.7% | -0.1% |
| Apartments | 31,084 | -2.5% | -37.2% |
| Villas and townhouses | 4,152 | -5.3% | -42.1% |
| Commercial | 1,484 | +8.0% | -5.1% |
| Plots | 680 | +14.9% | -39.2% |
| Off-plan share of transactions | 69% | ||
| Off-plan share of value | 59% | ||
| Mortgage registrations | 12,311 | -7.8% |
Sales value fell 15.8% QoQ on only 2.2% fewer transactions, so the average Q3 deal was about 14% smaller than the average Q2 deal (AED 2.48 million against AED 2.88 million). September reversed part of that, with an average of AED 2.60 million.
September accounted for 30.2% of Q3 transactions and 31.6% of Q3 value. A month that was simply average would be 33.3%. It was the weakest month of the quarter by count.
Dubai Property Market Outlook for Q4 2026
Our base case for Q4 2026 is a market that stabilises on volume at around 10,000 to 13,000 sales a month, with average prices flat to slightly lower and resale continuing to gain share.
Everything in this section is a forecast. It is Totality Real Estate’s reading of the September and Q3 data and should be treated as scenario analysis.
What the data says going into Q4
- Transaction momentum. Negative. Two consecutive monthly declines, and off-plan has fallen three months running.
- Seasonality. October to December 2025 were the three strongest months in the twelve-month series, at about 19,000 to 20,000 sales each. That also makes the YoY comparisons for Q4 2026 the hardest of the year.
- New project launches. Launches still move the numbers. One project added 263 sales in September. Q4 volume will depend heavily on how many large launches developers bring forward and how they are priced.
- Supply. Handover of units sold in 2024 and 2025 continues. Expect more completed stock in the rental and resale markets.
- International demand. Not measured in this dataset. Ultra-prime activity suggests wealthy buyers remain active.
- Mortgage environment. Registrations rose 7.2% MoM and 6.5% YoY. This is the most positive indicator in the data.
- Investor sentiment. Cautious toward off-plan, on the evidence of a 52% fall in off-plan sales. Constructive toward completed property.
- Rental yields. Under pressure while rents fall faster than prices.
- Luxury demand. Intact at the very top. 8% of September deals were above AED 5 million.
Bull Case
Seasonal demand returns and developers launch well-priced projects. Monthly sales recover to 13,000 to 15,000. Average price per sq. ft. holds between AED 1,650 and AED 1,700. Resale volumes keep growing and mortgage registrations stay above 4,000 a month.
What would confirm it: October sales above 13,000 and a halt in the decline of off-plan apartment sales.
Base Case
Monthly sales settle between 10,000 and 13,000. Off-plan stabilises around 7,000 to 8,500 a month and resale holds near 4,000. Average price per sq. ft. ends the year between AED 1,600 and AED 1,660, flat to about 3% lower. Off-plan’s share of transactions stays in the 60% to 68% range. Developers compete on terms more than on headline price. Apartment rents continue to drift lower.
This is the scenario we consider most likely.
Risk Case
Off-plan keeps falling by 10% or more a month. Total sales drop below 10,000. Average price per sq. ft. moves below AED 1,600 as developers cut launch prices and handover sellers accept discounts. Rent declines widen, especially on villas and small apartments in high-supply corridors.
What would signal it: resale volume turning down again after September’s rise, or a MoM decline in mortgage registrations alongside falling sales.
None of the three scenarios assumes a rapid return to 2025 volumes.
Dubai Real Estate Market Outlook for 2027
Our early view of 2027 is a year of lower volume than 2025, modest price movement in either direction, and a wide gap in performance between segments. This is a forecast and will be revised as Q4 data arrives.
| Segment | 2027 expectation | Reasoning from the data |
|---|---|---|
| Apartments | Mixed. Small units in high-supply corridors under pressure. Larger and well-located units stable | Primary apartment pricing -4.8% YoY, resale +1.6%. Rents -4.1% |
| Villas and townhouses | Capital values likely to hold better than apartments. Rental income is the weak point | Resale villa sales fell least. Villa rents -14.6% |
| Waterfront | Likely to outperform inland on price | Scarcity. Top September sales concentrated on the coast |
| Luxury | Deal flow continues but stays lumpy | Four villa sales above AED 100 million in one month. Small sample |
| Off-plan | Lower volumes. Better terms for buyers. Greater spread between strong and weak developers | Sales down 52% YoY. Demand concentrated in a few launches |
| Secondary | Likely to keep gaining share. The more reliable price reference | Share of value up from about 33% to 47% in a year |
| Emerging communities | The widest range of outcomes. Infrastructure delivery decides it | Dubai South led Q3 on volume, then slowed sharply in September |
Segments more likely to outperform: completed family housing in established communities, prime waterfront, and larger resale apartments bought below replacement cost.
Segments more likely to underperform: undifferentiated small off-plan apartments bought at 2025 launch prices, and any unit whose return depends on rents rising.
The variables to watch are the pace of handovers, the direction of rents, the mortgage rate environment and the volume of new launches. A fall in launches would be good for existing owners. A new wave of discounted launches would not.
What September 2026 Means for Buyers
Buyers had more negotiating power in September 2026 than a year earlier, particularly in off-plan, where a thinner market is also surfacing more below-market and off-market deals. This section is interpretation and general guidance. It is not personal advice.
- Buy now? For an end user who has found the right home, there is no strong case for waiting. Resale prices are stable, mortgage activity is rising and there is less competition. For an investor, the answer depends entirely on the unit. There is no market-wide reason to hurry.
- Negotiate. Yes, and expect results. With 44% fewer sales than a year ago, sellers and developers are competing for fewer buyers. In off-plan, negotiate terms as well as price: payment schedule, fee coverage and handover date.
- Focus on resale. For most buyers, resale is the better starting point this quarter. Apartments are 12.5% cheaper per sq. ft. than new stock, the building can be inspected and the rent is known.
- Selected off-plan. Still worth considering where the location has a real scarcity argument, the developer has a delivery record and the price is in line with nearby completed property.
- Launches to avoid. Small units in corridors where off-plan is 85% or more of sales, priced above local resale, sold on rental projections that ignore falling rents. Also any purchase where the plan is to assign before handover.
One practical test: find three completed units of the same size within the same area and compare price per sq. ft. If the launch is more expensive, ask what justifies the difference.
What September 2026 Means for Sellers
Sellers of completed, well-presented property in established communities still have a market. Sellers of off-plan units and of undifferentiated small apartments face a harder one.
- Pricing strategy. Price to recent registered transactions. Asking prices carried over from 2025 will sit. The citywide average is 2.4% below last September and off-plan apartments are 4.8% below.
- Liquidity. About 4,000 resales a month, against roughly 5,200 a year ago. Expect a longer marketing period and plan cash flow around it.
- Competition. Developers are the main competitor. A buyer comparing a resale unit with a launch offering a long payment plan needs a reason to choose the resale. Usually that reason is immediate rent, a known building and a lower price per sq. ft.
- Presentation. In a thinner market, condition and photography matter more. Vacant or well-staged property will outsell tenanted property with restricted viewings.
- Exclusive listing strategy. One accountable broker with a clear pricing plan avoids the same unit appearing at several prices, which buyers read as weakness.
- When sellers may need to discount. Off-plan units being assigned before handover. Small apartments in high-supply corridors. Villas bought as rental investments, given the 14.6% fall in villa rents.
- When sellers have pricing power. Completed villas and townhouses in the AED 2.6 million to AED 4.1 million bracket. Larger apartments in central and coastal areas. Anything prime on the water.
What September 2026 Means for Investors
For investors, September 2026 marks a shift from a market that rewarded participation to one that rewards analysis. Returns over the next two years will depend more on the specific asset and entry price than on the direction of the market.
Cash-flow investors
- Buy completed, tenanted or immediately lettable property.
- Underwrite on net yield using registered rents and the actual service charge.
- Assume flat to lower rents for the next twelve months. Apartment rents are down 4.1% YoY.
- Prefer areas with a deep tenant pool and a functioning resale market, such as Al Barsha South Fourth, over areas where most stock is still under construction.
Capital appreciation investors
- The easy gains from off-plan launches are over for now. Off-plan pricing is down 3.2% YoY.
- Look for scarcity: waterfront, low-density villa communities, larger units that developers are not building.
- If buying off-plan, require a discount to completed comparables. A premium is hard to justify in this market.
- Use a five-year horizon at minimum.
Luxury investors
- The segment is trading. Four villas above AED 100 million and five apartments at AED 30 million or more changed hands in one month.
- Liquidity at this level is always thin and prices are set by individual deals. Buy for long-term holding and personal use.
- Branded and waterfront stock dominated the top of the September list.
Portfolio investors
- Review off-plan exposure. A portfolio weighted to units handing over in 2026 and 2027 in high-supply corridors carries both price and rental risk.
- Consider rebalancing toward completed assets while resale demand is firm.
- Off-plan commercial property was the one off-plan category with rising sales, up 28.8% YoY. It deserves a look as a diversifier, with the caveat that 331 deals is a small base.
First-time Dubai investors
- Start with a completed apartment in an established community. It is the easiest asset to value, let and sell.
- Compare on price per sq. ft. A low ticket in a new area can be an expensive purchase.
- Budget for purchase costs, service charges and a vacancy period.
- Do not buy on a payment plan you could not complete if the unit could not be resold.
Frequently asked questions
How did the Dubai real estate market perform in September 2026?
Dubai recorded 11,288 property sales worth AED 29.4 billion in September 2026. Transactions fell 44.4% and value fell 45.8% compared with September 2025. The average price was AED 1,650 per sq. ft., down 2.4% YoY. Off-plan sales fell 51.8% while the secondary market fell about 23% and grew month over month.
How many properties were sold in Dubai in September 2026?
Dubai recorded 11,288 property sales in September 2026, according to DXB Interact data based on Dubai Land Department records. That included 9,055 apartments, 1,428 villas and townhouses, 539 commercial properties and 237 plots. Off-plan accounted for 7,271 sales and the secondary market for 4,017.
What was the total value of Dubai property sales in September 2026?
Total sales value was AED 29.4 billion in September 2026, down 45.8% from September 2025 and up 2.9% from August 2026. Apartments contributed AED 14.8 billion, villas and townhouses AED 8.6 billion, plots AED 3.8 billion and commercial property AED 2.2 billion.
What is the average price per square foot in Dubai?
The average price per sq. ft. in Dubai was AED 1,650 in September 2026, down 2.0% from August and 2.4% from September 2025. Off-plan property averaged AED 1,700. By median, new apartments sold at AED 1,703 per sq. ft. and resale apartments at AED 1,514.
Are Dubai property prices still increasing?
No. Dubai property prices were flat to slightly lower in September 2026. The citywide average fell 2.4% year over year to AED 1,650 per sq. ft. New apartment prices fell 4.8% while resale apartment prices rose 1.6%. Prices remain about 62% above September 2021.
What was the average Dubai property price in September 2026?
The average Dubai property transaction was AED 2.60 million in September 2026, calculated as AED 29.4 billion divided by 11,288 sales. The off-plan average was AED 2.13 million and the secondary average was AED 3.46 million. Apartments averaged AED 1.63 million and villas and townhouses AED 6.02 million.
Is off-plan property still profitable in Dubai?
It can be, but it is no longer profitable by default. Off-plan sales fell 51.8% year over year in September 2026 and off-plan prices fell 3.2%. Profits from assigning units before handover depend on rising launch prices, which the current data does not show. Selection of location, developer and entry price now decides the outcome.
Is it better to buy off-plan or ready property in Dubai?
For most buyers in late 2026, ready property is the lower-risk choice. Resale apartments cost 12.5% less per sq. ft. than new apartments, earn rent immediately and can be inspected. Off-plan still suits buyers with a long horizon who can secure a price in line with completed property nearby.
Which areas of Dubai had the most property sales in September 2026?
Dubai South led with about 820 sales, followed by Al Barsha South Fourth, which includes Jumeirah Village Circle, with about 800. Wadi Al Safa 3, Jabal Ali First and Wadi Al Safa 5 completed the top five. Together the five areas produced about 29% of all Dubai transactions.
Are rents falling in Dubai?
Yes. Average annual apartment rent was AED 70,000 in September 2026, down 4.1% from September 2025. Average villa rent was AED 205,000, down 14.6%. Commercial rent averaged AED 115,500, down 16.6%. Rents are falling faster than sale prices, which reduces gross yields.
Which areas of Dubai have the highest rental yields?
Yields are generally highest where price per sq. ft. is lowest and tenant demand is deep. Among high-volume areas, Al Barsha South Fourth and Wadi Al Safa 5 have the lowest apartment prices, at about AED 1,400 per sq. ft. Area-level rents were not part of this dataset, so yields should be checked against registered contracts.
What share of Dubai property buyers use a mortgage?
In September 2026, 32% of resale purchases in Dubai were financed with a mortgage and 68% were cash. Mortgage registrations totalled 4,038, up 6.5% year over year, with a combined value of AED 16.2 billion, up 37.6%.
Is Dubai real estate in a bubble?
The September 2026 data shows a correction in activity. It does not show a price collapse. Transactions are down 44% from a year earlier while average prices are down 2.4%. Two thirds of resale buyers pay cash, which limits forced selling. The main vulnerability is the volume of off-plan stock still to be delivered.
Is Dubai property overpriced in 2026?
It depends on the segment. New apartments sell at a 12.5% premium per sq. ft. to resale apartments while their prices are falling, which suggests launch pricing ran ahead of the market. Resale pricing has been stable. In several low-ticket areas, price per sq. ft. is higher than in established mid-market communities.
Will Dubai property prices fall in 2027?
Nobody can know. Our base case is modest movement in either direction, with wide differences between segments. Small off-plan apartments in high-supply areas face the most pressure. Completed villas and prime waterfront property are better supported. The direction of rents and the pace of handovers are the indicators to watch.
Is Dubai property still a good investment in 2026?
Selectively, yes. The market no longer lifts every purchase. Completed property bought at or below recent comparable sales, with realistic rent assumptions, still offers a sound case. Off-plan bought at a premium on optimistic projections carries more risk than it did a year ago.
How much money do you need to invest in Dubai property?
In September 2026, 34% of Dubai property sales were below AED 1 million. Average apartment prices in the most affordable high-volume areas ranged from about AED 600,000 to AED 750,000 in Q3 2026. Buyers should also budget for the 4% Dubai Land Department transfer fee, and a 2% agency fee on resale purchases.
Can foreigners buy property in Dubai?
Yes. Foreign nationals can buy freehold property in designated areas of Dubai without residency. A property purchase of AED 2 million or more can qualify the owner for a long-term Golden Visa, subject to the rules in force at the time of application.
What are the biggest risks of investing in Dubai real estate?
Want this read against a specific building or deal?
Send me the unit and I will tell you where it sits in this data, on price, rent and exit.