
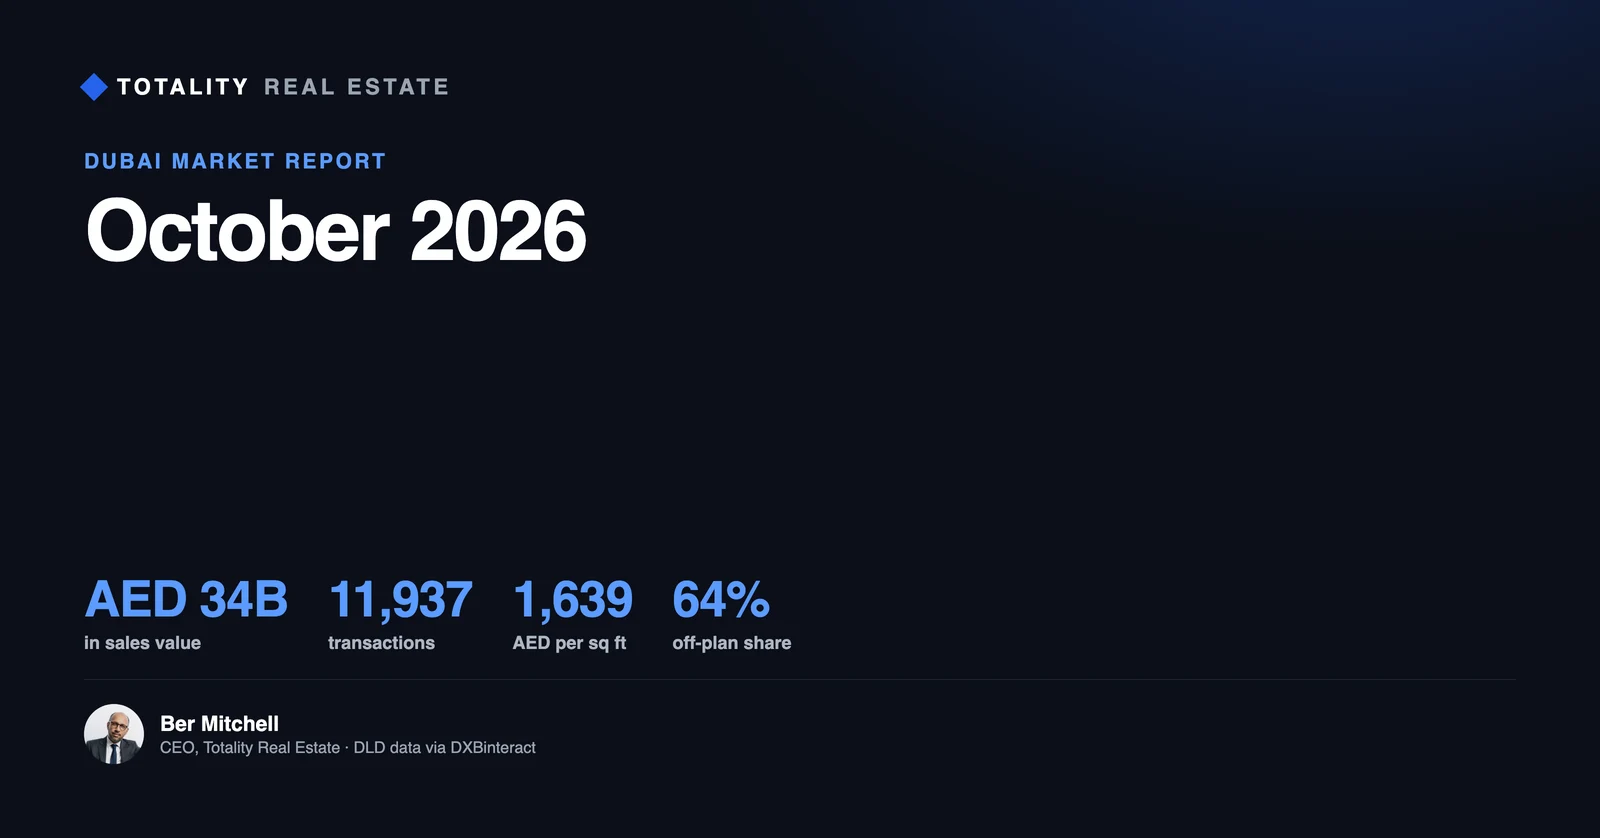
The October numbers are in, and they read better than the headline suggests. Dubai registered 11,937 property sales worth AED 34.0 billion, up 5.3% on September by volume and 14.4% by value. Against an exceptional October 2025, though, the market is about 40% smaller. Prices eased 1% to AED 1,639 per sq. ft., and off-plan did the heavy lifting again at 64% of all deals. Here is the full read, straight from the DLD register, with what it means if you are buying, selling or holding.
Executive Summary
Dubai recorded 11,937 property sales worth AED 34.0 billion in October 2026. Against September that is 5.3% more transactions and 14.4% more value, the second monthly rise in a row off the summer floor. Against October 2025 it is 39.9% fewer deals and 42.6% less value, because a year ago the market was running at a record pace that has since cooled.
Prices are flat to soft. The Dubai-wide average was AED 1,639 per sq. ft., down 1.0% on September and down 3.8% on October 2025. The median sale price actually rose 4.2% on the month to AED 1,394,000, which reflects mix more than momentum: fewer cheap off-plan studios cleared and more mid-market and villa deals registered.
Off-plan still leads. Developer (primary) sales were 7,609 deals worth AED 19.2 billion, 64% of volume and 57% of value. Resale was 4,328 deals worth AED 14.8 billion. The contraction against last year sits almost entirely in off-plan, which is where a year of fewer launches is now showing up in the registration data. The risk remains concentrated in a handful of high-supply districts.
The one-line read: Dubai is grinding higher month on month from a soft summer, while sitting well below the 2025 peak, with price holding and volume still led by off-plan.
October 2026 Dubai Real Estate Market at a Glance
| Segment | Transactions | Value (AED) | Price per sq. ft. (AED) |
|---|---|---|---|
| All sales | 11,937 | 34.01 billion | 1,639 |
| Off-plan (primary) | 7,609 | 19.21 billion | 1,668 |
| Secondary (resale) | 4,328 | 14.80 billion | 1,554 |
Key findings
- Volume up, value up month on month. 11,937 sales, +5.3% on September; AED 34.0 billion, +14.4%.
- Down about 40% on last year. October 2025 saw 19,856 deals worth AED 59.2 billion, a record run that has normalised.
- Price steady. AED 1,639 per sq. ft., within 4% of a year ago. The market has lost volume quickly and price slowly.
- Off-plan carries the market. 64% of deals and 57% of value were developer sales.
- Apartments dominate count, villas and plots dominate value per deal. 8,942 apartment sales at a median AED 1.15M; 1,362 villas at a median AED 4.07M.
Data and method
Figures are Dubai Land Department registrations for October 2026, retrieved via DXBinteract on 10 November 2026. Sales cover every registered property type. Month-on-month compares October with September 2026; year-on-year compares October 2026 with October 2025. The median is the midpoint deal; the average price per sq. ft. is the citywide figure across types. Late registrations can revise recent months slightly.
Dubai Property Transactions in October 2026
October was the second month of recovery after the summer low. Monthly volume bottomed near 10,300 in May, climbed back above 14,000 in June and July, dipped again in August, and has risen in both September and October. Value followed the same path and reached AED 34.0 billion, the highest since April.
August to October at a glance
The last twelve months
| Month | Transactions | Value (AED bn) | Median price (AED) | Price per sq. ft. (AED) |
|---|---|---|---|---|
| Nov 2025 | 18,997 | 64.64 | 1,545,000 | 1,758 |
| Dec 2025 | 18,672 | 63.36 | 1,487,465 | 1,816 |
| Jan 2026 | 17,295 | 71.78 | 1,819,999 | 1,816 |
| Feb 2026 | 17,112 | 61.34 | 1,697,614 | 1,788 |
| Mar 2026 | 13,539 | 43.58 | 1,674,774 | 1,799 |
| Apr 2026 | 14,074 | 48.48 | 1,700,000 | 1,824 |
| May 2026 | 10,298 | 29.06 | 1,210,150 | 1,655 |
| Jun 2026 | 14,107 | 34.10 | 1,170,000 | 1,695 |
| Jul 2026 | 14,243 | 35.37 | 1,150,000 | 1,691 |
| Aug 2026 | 12,081 | 28.86 | 1,209,000 | 1,689 |
| Sep 2026 | 11,340 | 29.73 | 1,337,615 | 1,656 |
| Oct 2026 | 11,937 | 34.01 | 1,394,000 | 1,639 |
The shape matters more than any single month. Volume is running roughly 35% to 40% below the same months of 2025, but price per sq. ft. is holding in a tight band around AED 1,640 to 1,820. That is the signature of a market repricing through activity, not through headline prices.
October in historical context
Put this October against previous Octobers and the normalisation is clear. The figures below are apartment, villa and commercial sales registered in October of each year.
| October | Transactions | Value (AED bn) | Apartment price per sq. ft. (AED) |
|---|---|---|---|
| 2019 | 3,379 | 5.05 | 1,347 |
| 2021 | 4,306 | 9.93 | 1,275 |
| 2022 | 7,531 | 19.89 | 1,675 |
| 2023 | 11,028 | 28.96 | 1,586 |
| 2024 | 17,818 | 43.42 | 1,679 |
| 2025 | 18,186 | 43.91 | 1,714 |
| 2026 | 10,844 | 26.12 | 1,669 |
October 2026 is still well ahead of 2019 to 2022, and roughly on a par with October 2023. It is the comparison with the 2024 to 2025 boom that makes the drop look severe. Apartment price per sq. ft., at AED 1,669, is within 3% of last October.
Dubai Property Sales Value
The AED 34.0 billion of October value split AED 19.2 billion to developers and AED 14.8 billion to the secondary market. Resale is punching above its transaction share: 36% of deals but 44% of value, because resale skews toward larger, higher-priced ready villas and prime apartments.
Average transaction value by segment
| Property type | Transactions | Value (AED) | Median price (AED) | Price per sq. ft. (AED) |
|---|---|---|---|---|
| Apartment | 8,942 | 14.75 billion | 1,149,000 | 1,669 |
| Villa | 1,362 | 9.10 billion | 4,069,819 | 1,359 |
| Townhouse | 649 | 2.02 billion | 2,994,000 | 1,575 |
| Commercial | 540 | 2.27 billion | 2,113,730 | 2,271 |
| Plot (land) | 443 | 5.87 billion | 5,629,183 | 468 |
Apartments are 75% of the deal count but only 43% of the value. Villas and plots, at 1,805 deals combined, account for AED 15.0 billion, close to half the market by value. For context, the most expensive single villa registered in October sold for AED 97 million.
Dubai Average Price Per Square Foot
The citywide average held at AED 1,639, down 1.0% on the month. The off-plan average (AED 1,668) now sits above the resale average (AED 1,554), a 7% premium for buying new, which is the same gap we flag in our off-plan versus ready comparison.
Median price per sq. ft. by property type
| Type | Off-plan (AED/sqft) | Resale (AED/sqft) | Combined (AED/sqft) |
|---|---|---|---|
| Apartment | 1,719 | 1,534 | 1,669 |
| Villa | 1,242 | 1,629 | 1,359 |
| Commercial | 2,305 | 2,037 | 2,271 |
Note the villa line: resale villas (AED 1,629) cost more per foot than off-plan villas (AED 1,242), the reverse of apartments. New villa launches sit further out where land is cheaper, while the priciest ready villas are on the established fronds and golf communities.
Off-Plan vs Secondary Market
This is the single most important split in the Dubai market right now.
Off-plan (primary) market
7,609 off-plan sales worth AED 19.2 billion, at AED 1,668 per sq. ft. Off-plan is 64% of October volume. The busiest off-plan districts were Dubai South (713 deals), Jumeirah Village Circle (445), Al Rowaiyah First (429), and the Wadi Al Safa 3 and 5 corridors. These are the high-launch, high-handover zones where supply risk is greatest.
Secondary (resale) market
4,328 resale deals worth AED 14.8 billion, at AED 1,554 per sq. ft. Resale value is concentrated in prime: Palm Jumeirah (AED 938 million), Business Bay (AED 707 million), Dubai Marina (AED 698 million), Sobha Hartland and MBR City (AED 674 million) and Downtown Dubai (AED 643 million) led on value. By count, Jumeirah Village Circle (392) and Business Bay (337) led.
Which segment suits which buyer
Off-plan suits a buyer who wants a payment plan and a new building and can wait, and who buys where supply is controlled rather than flooding. Resale suits a buyer who wants income from day one and a price tested against the DLD record. In today’s market, with off-plan priced 7% above resale per foot and a heavy 2027 to 2028 handover pipeline, the resale and distressed off-plan assignment routes are where the clearer value sits.
Thinking about a purchase this quarter?
Send me the project or the unit and I’ll price it against October’s DLD registrations, tell you where it sits on supply risk, and what it realistically rents for. Straight answer, no obligation.
Apartment Market Analysis
Apartments were 8,942 of the 11,937 deals and AED 14.75 billion of value, at a median AED 1,149,000 and AED 1,669 per sq. ft. Off-plan apartments (5,775 deals) outsold resale apartments (3,167) by close to two to one.
Where apartment demand sat
By volume, apartment activity clustered in Jumeirah Village Circle (815 deals), Dubai South (732), the Wadi Al Safa 3 corridor (473), Jebel Ali First (406) and Wadi Al Safa 5 (396). By value, prime led: Business Bay (AED 862 million), Jumeirah Village Circle (AED 847 million), Dubai Marina (AED 832 million), Palm Jumeirah (AED 741 million) and Downtown (AED 704 million). The pattern is consistent: the affordable belt drives the deal count, prime drives the money.
Villa and Townhouse Market Analysis
Villas were 1,362 deals worth AED 9.10 billion at a median AED 4.07M; townhouses added 649 deals worth AED 2.02 billion at a median AED 2.99M. Together, houses were 17% of deals but 33% of value.
Where villa money went
Villa value concentrated in Al Rowaiyah First (AED 1.10 billion, a single large community registration), the Al Yufrah and Palm Jebel Ali land-and-villa plays, Sobha Hartland and MBR City (AED 618 million) and the Al Hebiah golf belt. Palm Jebel Ali continues to register strongly on value even as the build-out timeline keeps it a long-horizon hold.
Are villas still outperforming apartments?
On a per-foot basis the villa premium has compressed. Combined villa price per sq. ft. (AED 1,359) is now below apartments (AED 1,669), because so much villa volume is new land-heavy product on the city’s edge. The scarce, established villa remains the stronger asset; the median masks a wide split between a Palm or Hills villa and a 2028-handover plot.
Top Performing Dubai Areas
Highest transaction volume (all sales)
| Area | Transactions |
|---|---|
| Jumeirah Village Circle | 837 |
| Dubai South | 784 |
| Wadi Al Safa 3 | 509 |
| Business Bay | 457 |
| Jebel Ali First | 457 |
Highest transaction value (all sales)
| Area | Value (AED) |
|---|---|
| Business Bay | 1.74 billion |
| Al Rowaiyah First | 1.10 billion |
| Palm Jumeirah | 1.03 billion |
| Sobha Hartland / MBR City | 1.02 billion |
| Wadi Al Safa 3 | 0.96 billion |
Most active off-plan and secondary communities
| Off-plan, by deals | Secondary, by deals |
|---|---|
| Dubai South (713) | Jumeirah Village Circle (392) |
| Jumeirah Village Circle (445) | Business Bay (337) |
| Al Rowaiyah First (429) | Dubai Marina (214) |
| Wadi Al Safa 3 (398) | Sobha Hartland / MBR City (162) |
| Wadi Al Safa 5 (339) | Dubai Marina area / Al Thanyah Fifth (159) |
The takeaway: off-plan volume is piling into the same south and central corridors that already have the heaviest 2027 to 2028 pipelines, while resale demand is split between the affordable JVC market and prime Business Bay, Marina and Palm.
Dubai Luxury Property Market
The top end stayed active. Five apartment sales above AED 36 million and five villa sales above AED 64 million registered in October.
Highest-priced sales, October 2026
| Apartment | Area | Price (AED) |
|---|---|---|
| Balqis Residence, Beach Villas | Palm Jumeirah | 55,000,000 |
| W Residences Dubai, The Palm | Palm Jumeirah | 53,700,555 |
| Orla by Omniyat | Palm Jumeirah | 49,422,470 |
| One Sankari, West Tower | Business Bay | 46,250,000 |
| Mercedes-Benz Places by Binghatti | Downtown Dubai | 36,299,999 |
| Villa | Area | Price (AED) |
|---|---|---|
| Villa | Sobha Hartland / MBR City | 97,000,000 |
| Villa | The World Islands | 79,000,000 |
| Villa | Palm Jumeirah | 78,000,000 |
| Villa | Me’Aisem Second | 69,876,751 |
| Villa | Ghadeer Al Tair | 64,000,000 |
Palm Jumeirah took three of the five top apartment sales. The ultra-prime segment has been the most resilient part of the market all year, insulated from the off-plan supply story that drives the mid-market.
Rental Market
Renting tells the other half of the story: supply is catching up with tenants. New apartment leases registered a median AED 67,442 a year in October, down 6.3% on a year ago, while renewals held at AED 60,000, up 4.9%. The gap between what sitting tenants pay and what the market now asks has narrowed, and in parts of the apartment market new asking rents have slipped.
| Type | New lease (AED/yr) | YoY | Renewal (AED/yr) | YoY |
|---|---|---|---|---|
| Apartment | 67,442 | -6.3% | 60,000 | +4.9% |
| Villa | 214,618 | -4.6% | 200,000 | +14.4% |
| Commercial | 115,192 | +24.7% | 89,800 | -10.2% |
Gross yields
On October medians, gross apartment yield works out near 5.9% (AED 67,442 rent on an AED 1.15M price) and villa yield near 5.3% (AED 214,618 on AED 4.07M). Commercial new-lease rents jumped, consistent with the tight Grade A office market covered in our Dubai commercial property guide.
Gross yield is not net yield
Service charges of roughly AED 12 to 30 per sq. ft. a year, plus management, voids and maintenance, take a point or more off the gross figure. Always underwrite on net, and price rent off today’s new-lease level, not last year’s. Our yields guide works through the full calculation.
Supply Pipeline and Oversupply Risk
October added 6,128 units across 20 project launches and delivered 2,289 units across 11 completions. The launch total is modest by recent standards, and that is the point: developers launched far less in 2026 than in the prior two years.
| Supply measure | Figure |
|---|---|
| Units launched, October 2026 | 6,128 (20 projects) |
| Units delivered, October 2026 | 2,289 (11 projects) |
| Units launched, 2026 year to date | ~78,300 |
| Units launched, 2025 year to date | ~145,200 |
| Units delivered, 2026 year to date | ~43,100 |
| Planned handovers, 2027 | ~122,600 |
| Planned handovers, 2028 | ~116,500 |
Where supply is concentrated
The 2027 and 2028 handover waves are heaviest in Dubai South, the Wadi Al Safa 3, 4 and 5 corridors, Jumeirah Village Circle, Al Hebiah and Dubai Islands. These are the same districts leading off-plan sales today, which is the crux of the oversupply risk: owners there will be looking for the same tenants and buyers at the same time. Our off-plan risk-areas analysis maps where that pressure is sharpest.
Where the pressure is likely to fall
Of the units under construction city-wide, a very large share is still early stage, so the heaviest completions land in 2027 and 2028, not now. Scarce, land-constrained districts, the established prime fronts and finished communities with little new supply should hold up best. High-launch strata districts face the most price and rent competition as they hand over.
Investor Risks
- Supply timing. The 2027 to 2028 handover wave is concentrated in a few high-launch districts. Count the units completing within a kilometre of any off-plan unit in the same year.
- Off-plan premium. New stock registers about 7% above resale per foot while prices are flat. Underwrite on a rent and a resale value you can evidence today.
- Volume, not price, is moving. A 40% fall in transactions with flat prices means slower exits. Budget for a longer sale, especially above AED 5 million and in thin villa communities.
- Mix effects. Headline median swings reflect what registered that month. Judge a specific building against its own recent sales, not the citywide number.
October 2026 vs October 2025
A year ago the market was near its peak: 19,856 deals worth AED 59.2 billion in a single month. October 2026, at 11,937 deals and AED 34.0 billion, is 39.9% lower by volume and 42.6% lower by value, with price per sq. ft. off 3.8%. The fall is a return to a sustainable pace after an exceptional 2024 to 2025 run, not a collapse in values. Price has held while the speculative, high-churn off-plan volume has thinned out.
Dubai Property Market Outlook
Over the five years to 2025, Dubai’s median price per sq. ft. compounded at about 12% a year, and 2025 closed at a record 215,608 sales worth AED 686 billion. 2026 is the digestion year after that run.
Base case into year-end
Volume grinding higher month on month off the summer low, prices broadly flat, and off-plan still leading. A seasonally firmer November and December are likely, as the last two months of the year usually register well, but full-year 2026 will land clearly below 2025.
Bull case
Rate cuts and continued population growth pull end-user and investor demand back toward the 2024 to 2025 pace, and prices resume a mid-single-digit climb in supply-constrained areas.
Risk case
The 2027 to 2028 handover wave meets softer demand, rents keep slipping in high-supply districts, and off-plan resale discounts widen before completion. This is the scenario to hedge by choosing location and entry price carefully.
What October 2026 Means for Buyers
You have negotiating room you did not have a year ago. With volume down 40% and prices flat, sellers who need to move are more flexible, and off-plan assignors are increasingly asking below their original price. Buy ready or near-complete in supply-constrained areas, price every deal against October’s DLD registrations, and do not pay the off-plan premium unless the building and location clearly justify it.
What October 2026 Means for Sellers
Price to the market, not to last year. Values are flat, but exits are slower because there are fewer buyers. A realistic price against recent registrations in your own building sells; a 2025-peak asking price sits. Above AED 5 million and in thinner communities, allow more time.
What October 2026 Means for Investors
Cash-flow investors: yields near 5.9% gross on apartments are workable, but underwrite net and off today’s new-lease rents, which have softened. Capital-growth investors: favour scarce, land-constrained locations over high-launch strata districts facing the handover wave. Luxury and portfolio investors: the top end has been the most resilient segment all year; prime Palm, Downtown and Business Bay held value while the mid-market cooled. Someone with cash who can move within days has the strongest hand in a 40%-lower-volume market.
Frequently asked questions
Did Dubai property prices fall in October 2026?
Barely. The citywide average was AED 1,639 per sq. ft., down 1.0% on September and 3.8% on October 2025. The median sale price actually rose 4.2% on the month to AED 1,394,000, which reflects the mix of deals that registered rather than genuine price growth. Dubai is losing transaction volume quickly and price slowly.
How many properties sold in Dubai in October 2026?
Dubai registered 11,937 property sales worth AED 34.0 billion in October 2026, according to DLD data. That is 5.3% more deals than September and 14.4% more value, but 39.9% fewer deals than October 2025, when the market was near its peak at 19,856 sales.
Is Dubai property cheaper than a year ago?
Slightly, per square foot. The citywide average of AED 1,639 is about 3.8% below October 2025. The bigger change is activity: transactions are down roughly 40% year on year. Values have held while speculative off-plan volume has thinned out.
Is now a good time to buy property in Dubai?
For a cash-ready buyer, the softer market offers negotiating room that was not there a year ago, with sellers and off-plan assignors more flexible. The caveat is supply: favour ready or near-complete stock in supply-constrained areas over high-launch districts facing the 2027 to 2028 handover wave, and price every deal against recent DLD registrations.
How much new supply is coming to Dubai?
Developers delivered about 43,100 units in the first ten months of 2026 and launched about 78,300, well down on 2025. The pipeline is heavier ahead: roughly 122,600 units are planned for handover in 2027 and 116,500 in 2028, concentrated in Dubai South, the Wadi Al Safa corridors, JVC, Al Hebiah and Dubai Islands.
Data: Dubai Land Department sale registrations via DXBinteract, retrieved 10 November 2026. Figures cover registered transactions and can be revised as late registrations post. This report is market analysis, not financial advice.
Ber Mitchell, CEO, Totality Real Estate | RERA licensed