Dubai sales stats October 2025: AED 59B in deals, 19,800+ transactions, 70% off-plan and rising rents. See which areas and property types are winning.
In October 2025, Dubai’s property market did something quite subtle.
It did not break records. It held its ground.
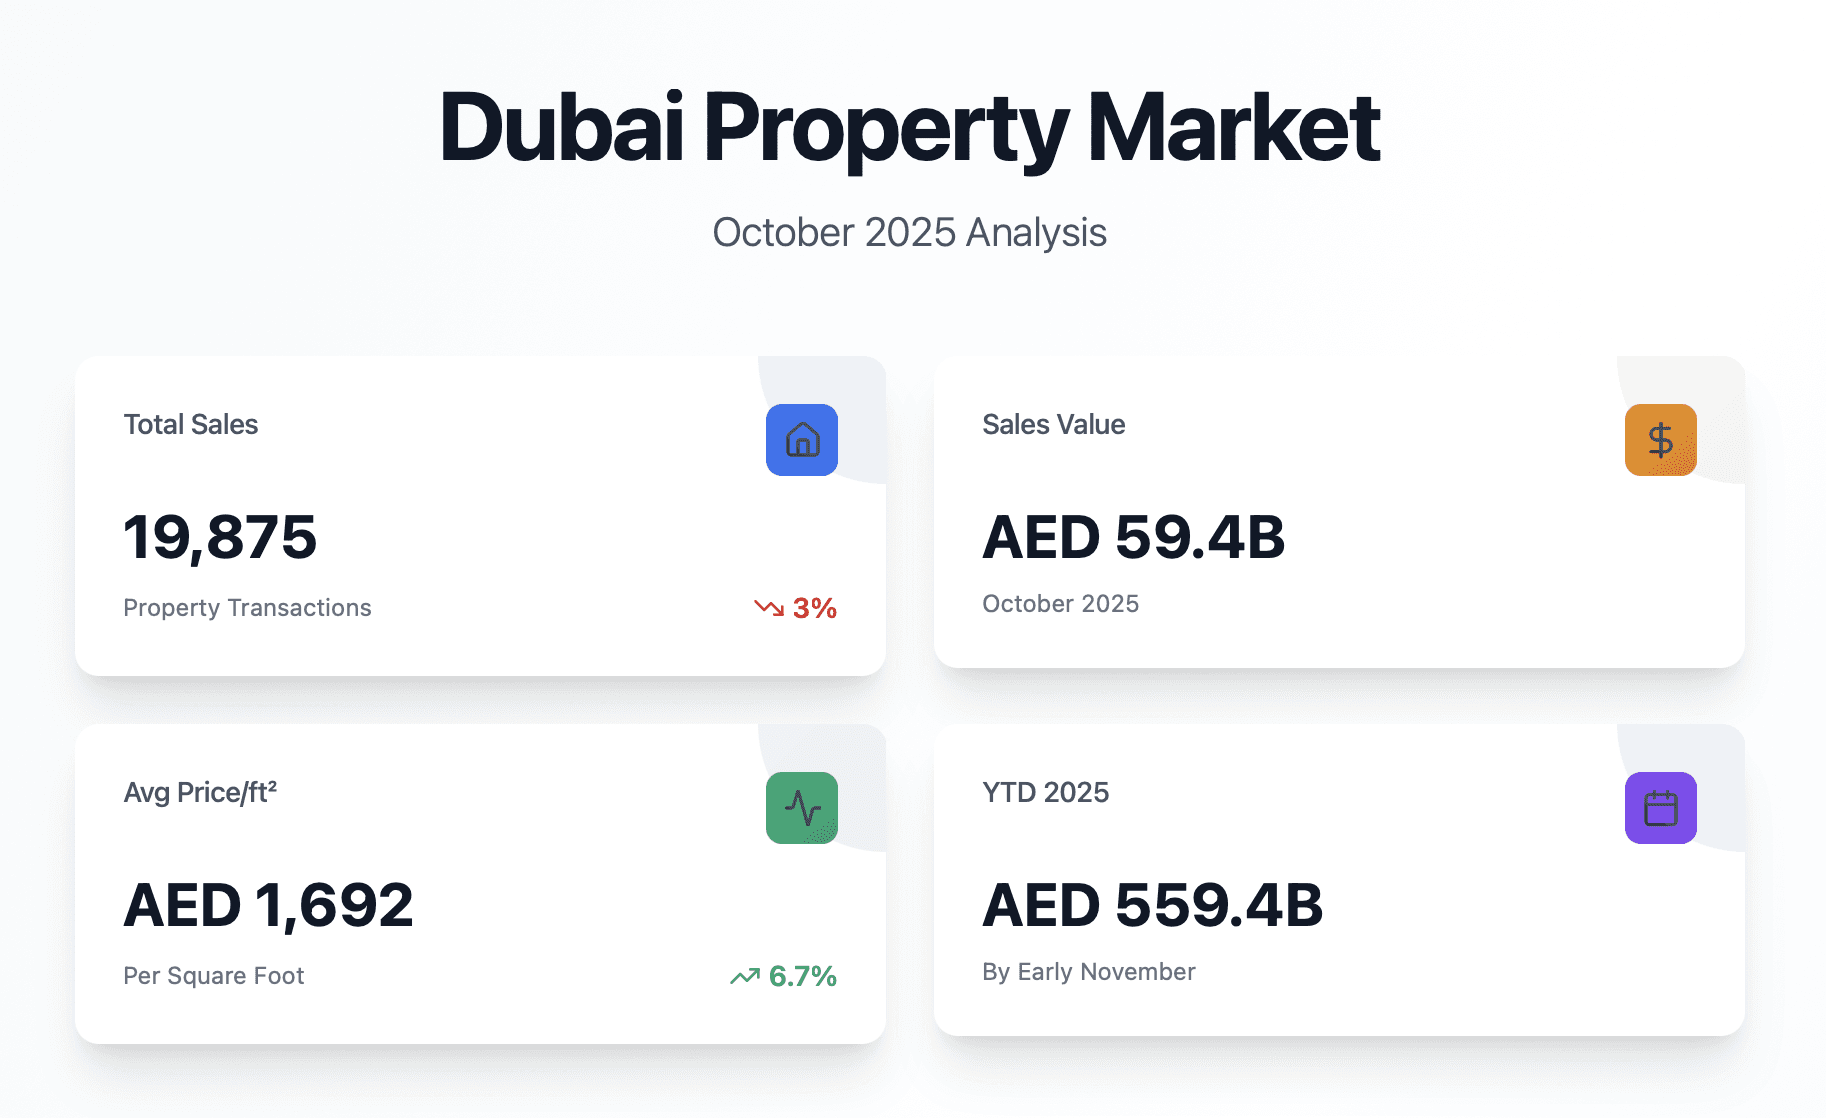
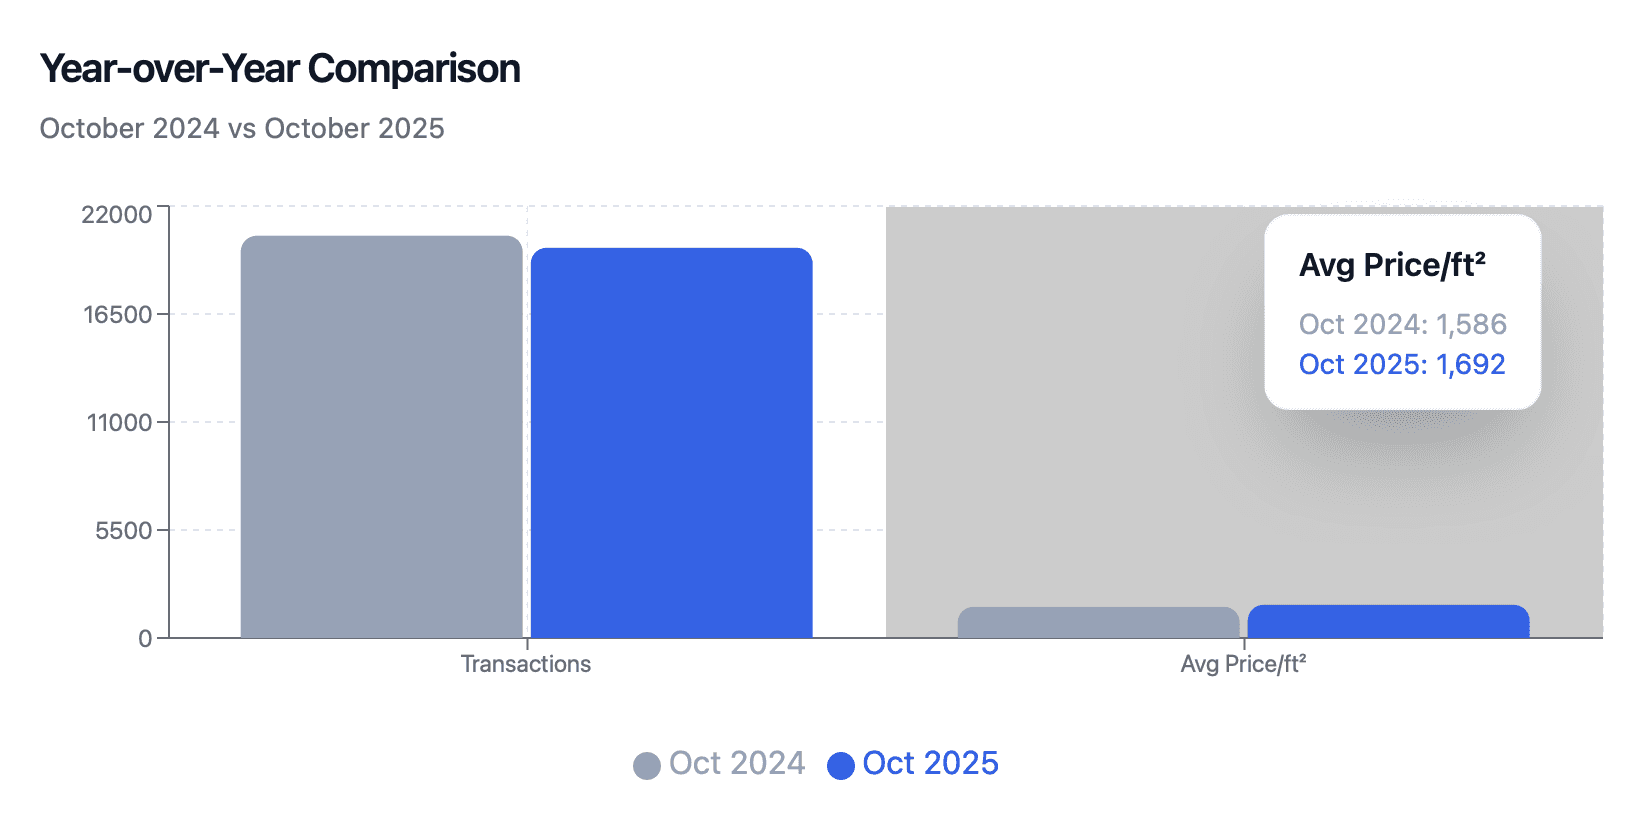
Roughly 19,875 property sales were recorded, with a total sales value of around AED 59.4 billion, according to DLD and DXB Interact–based analyses. That is slightly fewer transactions than October 2024 (about 3% lower), yet buyers paid more per square foot: an average of AED 1,692/ft², up roughly 6.7% year-on-year.
So volumes cooled a touch. Prices did not. And that, I think, is the real story.
Behind those headline numbers sits a very particular market structure:
Off-plan sales still dominate at about 70% of transactions and 65% of value, showing deep confidence in Dubai’s pipeline of new launches.
Resales (secondary market) make up the remaining 30% of deals and 35% of sales value, still highly liquid but clearly not the main driver.
When you zoom out, you also see the bigger 2025 picture: by early November, Dubai had already crossed AED 559.4 billion in year-to-date real estate sales, surpassing 2024’s full-year total. October is just one tile in that mosaic—but an important one if you are planning your next move.
This guide walks through Dubai’s sales stats for October 2025 in a practical, investor-friendly way: first the numbers, then the meaning behind them. I will highlight what matters if you are a homebuyer, yield investor, or developer trying to position your next launch.
Key Market Statistics – October 2025 at a Glance
Let’s start with the core metrics and then layer in nuance.
Headline Numbers
Market Snapshot – October 2025 (Dubai)
Metric | October 2025 | YoY Change vs Oct 2024 | Notes |
|---|---|---|---|
Total Transactions | ~19,875 (range seen: 18,232–19,875) | -3% (approx.) | Slight cooling in volume after record 2024 |
Total Sales Value | ≈ AED 59.4 billion | ≈ +3.1% | Higher values despite fewer deals |
Average Price per Sq Ft | AED 1,692 | +6.7% YoY | Buyers paying more for each ft² |
Off-Plan Share (Volume) | ~70% | Up vs pre-2022 norm | Developers drive most of the action |
Resale Share (Volume) | ~30% | Slightly subdued | Secondary still deep but not leading |
Mortgages (Transactions) | 4,880 | +12.9% YoY | More end-users & leveraged investors |
Mortgages (Value) | AED 16.6 billion | +2.3% YoY | Debt is growing, but not overheating |
A small personal observation here: when you see volume slightly down and price per ft² higher, it often means the market is becoming more selective, not weaker. Fewer but more serious transactions. In October, many buyers seemed to prioritize quality assets, trusted developers, and future yield over just “getting something in Dubai”.
Long-Term Context
It helps to see October 2025 in the context of the last decade:
Average price per ft² has climbed from around AED 981 in 2014 to roughly AED 1,688–1,692 in 2025.
2025 year-to-date (by early November) crossed AED 559.4 billion in sales, already beating previous records.
Monthly transactions in 2025 oscillated between c. 14,000 and 20,000, with October holding near the high end at around 19,875.
In other words, October 2025 is not an outlier spike; it’s part of a sustained high-activity cycle, with a gentle normalization in volumes after the post-pandemic surge.
From a data-driven investor’s lens (and this is how we think at Totality Real Estate), that kind of pattern usually favors disciplined buyers: those who track micro-markets, developer behavior, and payment plans, not just headlines.
Off-Plan vs Secondary Market – Where the Smart Money Went
If you only remember one structural detail about October 2025, make it this:
Roughly 70% of all deals were off-plan (first sales), with 65% of the month’s total sales value.
Resales (secondary market) accounted for about 30% of transactions and 35% of value.
Off-Plan Dominance in Numbers
Segment | Volume Share (Transactions) | Value Share (AED) | What it Signals |
|---|---|---|---|
Off-Plan (1st Sale) | ~70% | ~65% | Strong trust in new launches, payment plans, and 3–5-year outlook |
Secondary / Resale | ~30% | ~35% | Solid liquidity but less “headline” activity than developer launches |
This off-plan tilt is not a one-month fluke; it’s consistent with broader 2025 trends, where record sales were largely driven by first-time developer transactions.
Why? A few reasons I see repeatedly when speaking with investors:
Payment plans still rule psychology.
Stretching equity over 3–5 years with a post-handover component is easier to digest than a heavy upfront down payment on a ready unit—even if the IRR ends up similar.Branded and master-planned communities.
Off-plan launches in JVC, Dubai South, Dubai Islands, Business Bay extensions, and new branded towers (like the Bulgari Lighthouse or Peninsula series) feel like a way to “buy into the story” of Dubai 2030, not just a flat.Developers competing for attention.
Incentives, fee waivers, DLD offers, and creative handover structures keep the off-plan funnel full. In October, best-selling projects like Damac Riverside, Binghatti Flare, and Nad Al Sheba First were top of the leaderboard for volume and total value.
Meanwhile, the secondary market is far from dead; it is just more rational:
More mortgage-backed buyers.
More price sensitivity, especially in older stock.
Stronger activity in well-managed communities where rental yields are proven rather than promised.
If you want a deeper dive into off-plan risk versus reward, you might find this helpful later:
Read: Dubai Off-Plan Properties: Goldmine or Death Trap? – a data-led breakdown of launch cycles, payment plans, and exit strategies.
Mortgages: A Quiet but Important Signal
One detail that tends to be buried in monthly reports is the mortgage data. In October 2025:
4,880 mortgage deals were registered, worth AED 16.6 billion.
That is about 12.9% more loans than in October 2024, with mortgage value up around 2.3%.
What does that tell us?
A growing share of buyers are end-users and long-term expats, not purely cash-rich speculators.
Banks remain comfortable with Dubai’s risk profile; if they were nervous, you would see tighter lending or much softer growth in mortgage counts.
For investors, it means exit liquidity is supported by financed end-users—especially in established areas like Business Bay, JLT, Dubai Marina, and mature parts of JVC.
I sometimes describe this to clients as “the oxygen of the market”. Prices can move around, launches can ebb and flow, but if mortgage financing is expanding, it is usually a sign that the ecosystem is functioning healthily.
Property Type Performance: Apartments, Villas, Commercial, and Plots
If you peel back the October 2025 numbers, the first thing that jumps out is how different each property type behaved. Same city, same month, completely different stories.
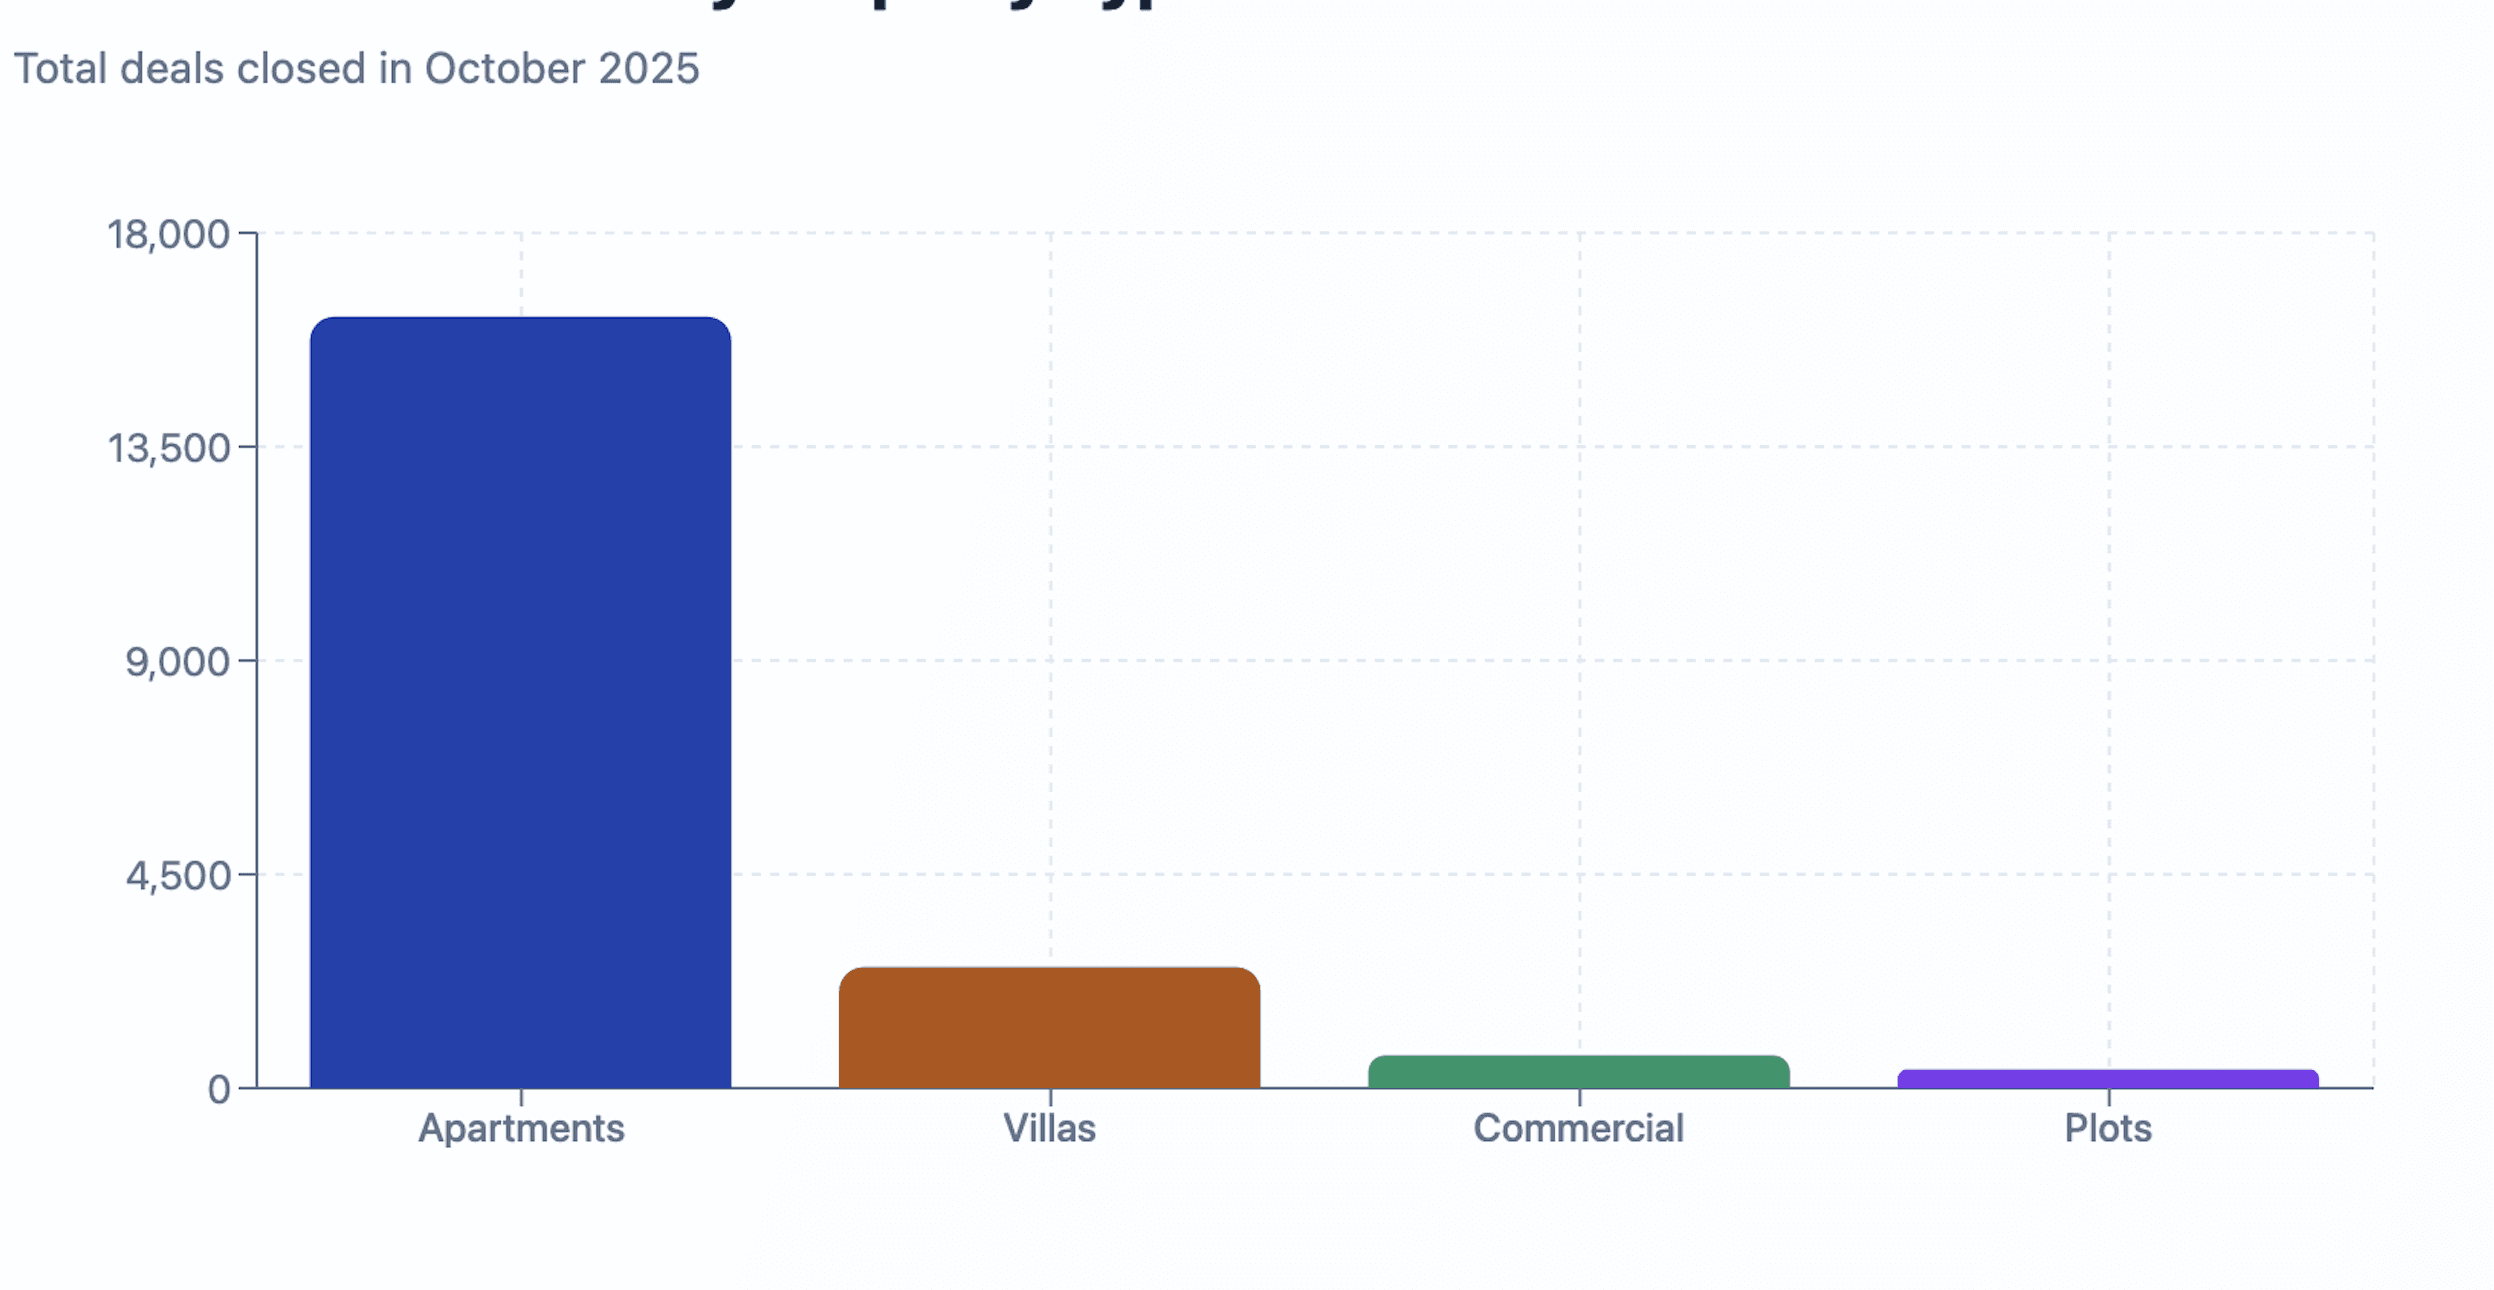
According to DLD- and DXB Interact–based reports, here is the core breakdown of what sold most in October:
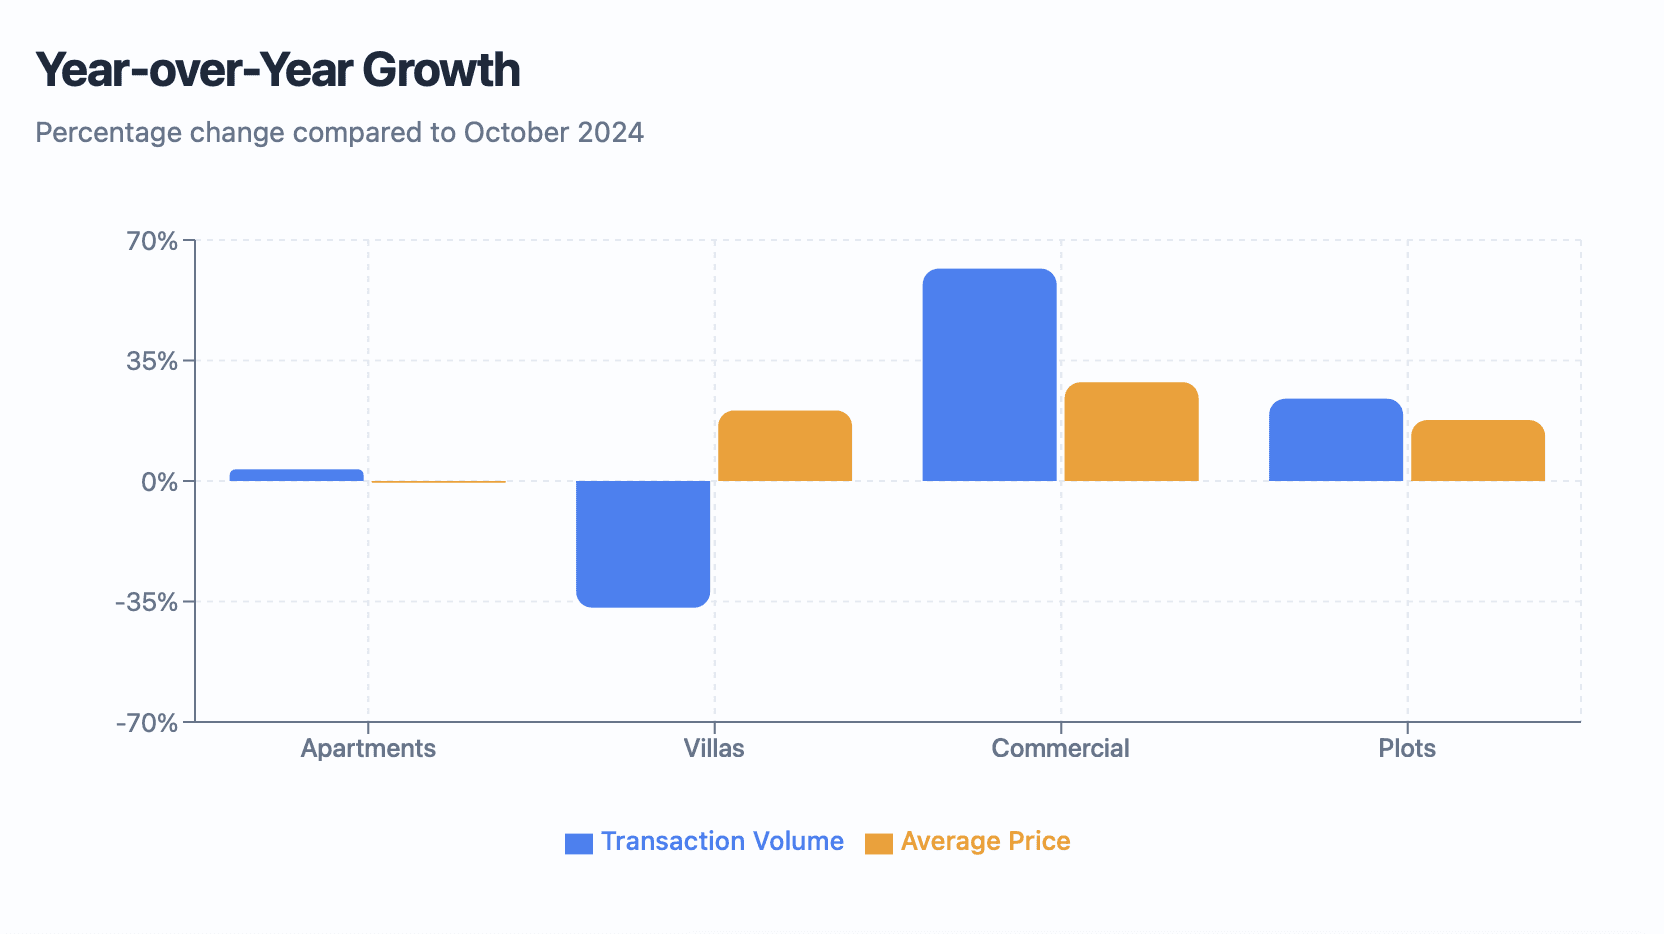
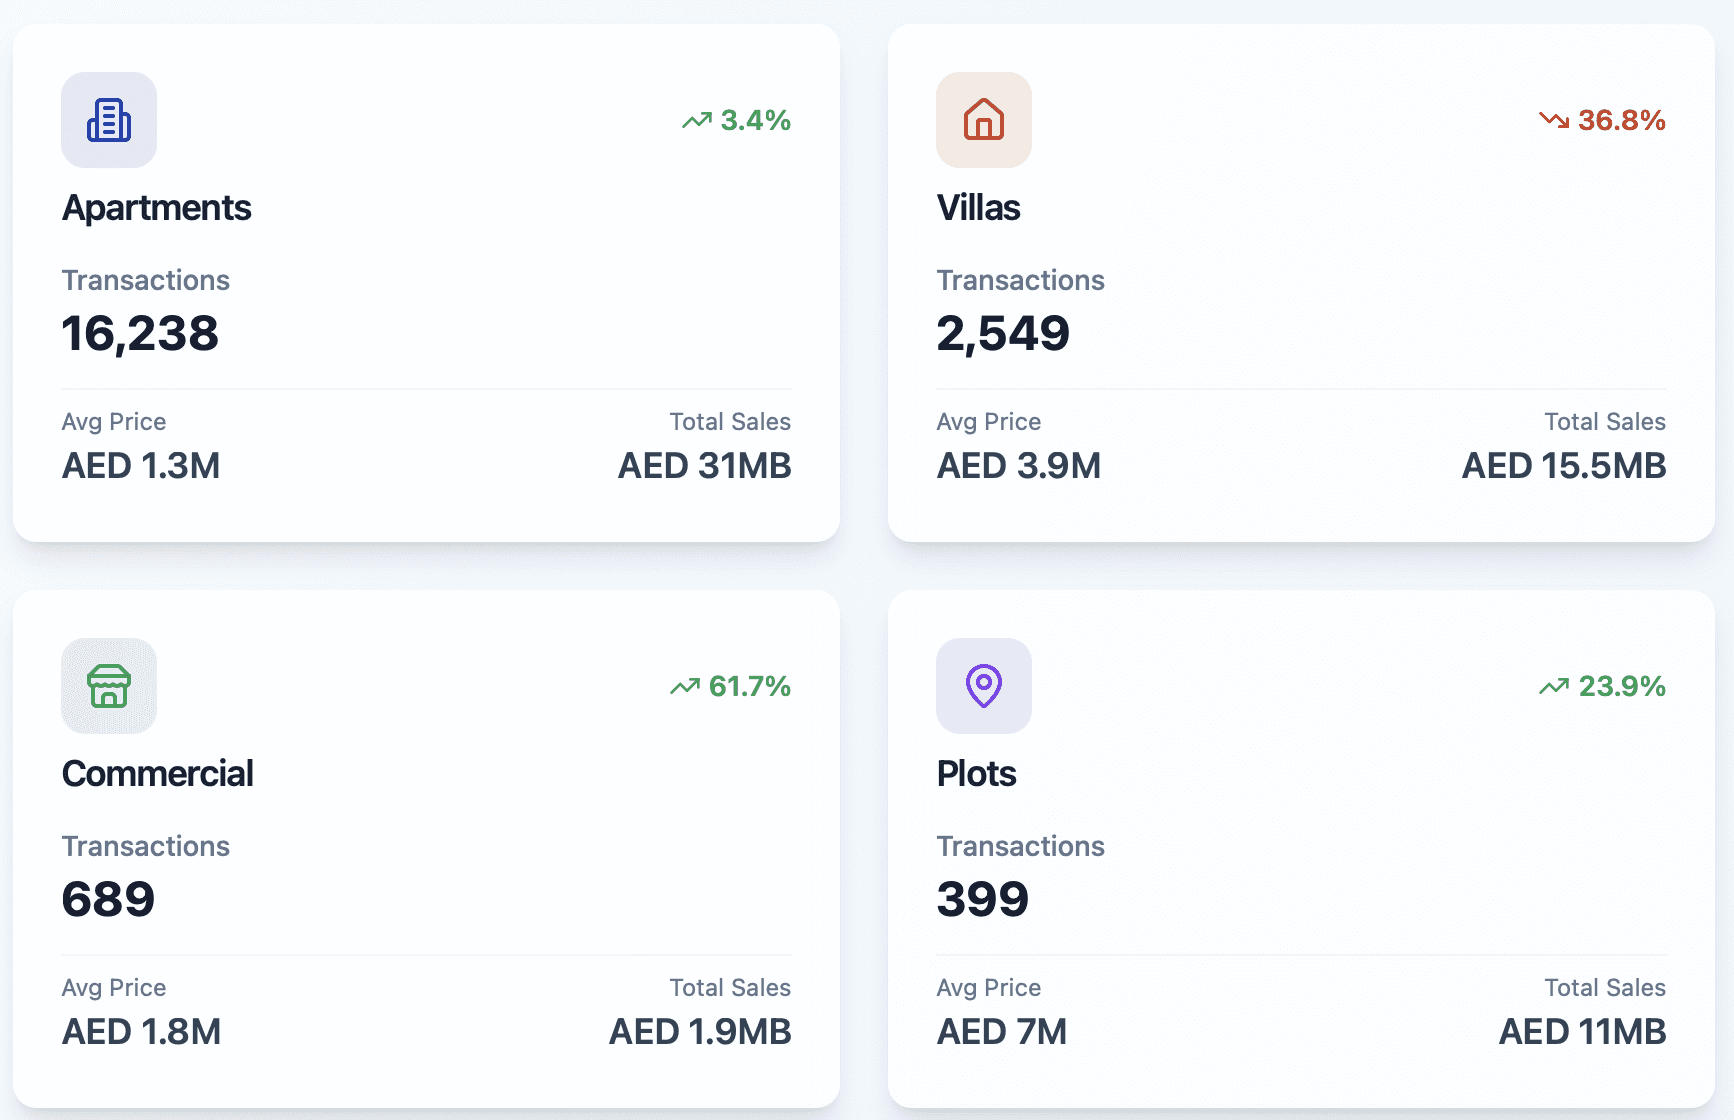
Apartments: 16,238 transactions (+3.4% YoY) – sales value about AED 31 billion
Villas: 2,549 transactions (-36.8% YoY) – sales value about AED 15.5 billion
Commercial units: 689 deals (+61.7% YoY) – sales value about AED 1.9 billion
Plots: 399 deals (+23.9% YoY) – sales value about AED 11 billion
At the same time, average ticket prices moved in their own directions:
Apartments averaged AED 1.3 million (-0.5% YoY)
Villas averaged AED 3.9 million (+20.5% YoY)
Commercial units averaged AED 1.8 million (+28.7% YoY)
Plots averaged AED 7 million (+17.7% YoY)
If you imagine the market as a table with four legs, apartments are still the heaviest leg. But the fastest-growing legs, price-wise, are clearly villas, commercial units, and plots.
Property Type Snapshot – October 2025
Property Type | Transactions | Sales Value (Approx.) | Share of Sales Value | Avg Ticket Price | YoY Price Change |
|---|---|---|---|---|---|
Apartments | 16,238 | ~AED 31B | 52% of value | AED 1.3M | -0.5% |
Villas | 2,549 | ~AED 15.5B | 26% | AED 3.9M | +20.5% |
Plots | 399 | ~AED 11B | 18% | AED 7M | +17.7% |
Commercial | 689 | ~AED 1.9B | 3% | AED 1.8M | +28.7% |
(Numbers rounded; based on aggregated October 2025 market reports and DXB Interact data.)
Now, what does this actually mean in plain language?
Apartments – Volume King, Price Flatlining (For Now)
Apartments are still the backbone of Dubai’s real estate market. With over 16,000 deals and more than half of all sales value (52%), they are where most of the liquidity sits.
But the average price tellingly dipped by about 0.5% YoY, even as transaction counts rose.
In practice, that suggests a few things:
Buyers are slightly trading down in ticket size or shifting towards more affordable locations, even if they are buying more units.
The big wave of new supply—especially in mid-market communities—is starting to cap price acceleration at the city-wide level.
For investors, apartments are quietly turning into a yield play, not just a capital-gain story.
If your strategy is to build a rental portfolio, this is actually not bad news at all. A relatively flat entry price combined with rising rents (we will come to that in a moment) can mean improving net yield over time.
If you want to go deeper into rentals and yield calculations across communities, you might like:
Read: Dubai Rental Market 2025–2030 Outlook: Trends, Yields, and Investment Insights
Villas – Fewer Deals, Much Higher Prices
Villas did something almost opposite.
Transactions fell by roughly 36.8% YoY,
but the average villa price jumped about 20.5% to around AED 3.9M.
This kind of pattern usually points to:
A base effect (last year was unusually strong, so comparisons look harsh).
A tilt towards higher-end stock: more activity in prime and ultra-prime villa communities, fewer deals at the budget end.
Owners becoming more confident and less willing to sell cheaply in established villa districts.
Investors who bought villas in 2022–2023 are, in many cases, sitting on chunky equity gains. New villa buyers in October 2025 were, on average, paying up for lifestyle, not just returns.
I would not call this segment “overheated” based only on October, but it is clearly not the bargain rack either.
Commercial Units – Quiet Winner of October
Commercial property is often ignored in casual conversations, but in October it behaved like the overachiever in the background:
Transactions jumped 61.7% YoY,
Average prices rose 28.7% YoY,
Yet commercial still represented only 3% of total sales value.
This is one of those segments where the headline share looks tiny, but the signal is meaningful:
Businesses and investors are quietly locking in office and retail space at still-attractive rates compared with global cities.
Some buyers are positioning for population growth and new communities (think Dubai South, Dubai Islands, parts of Business Bay and beyond).
Commercial is also where a lot of mispricing can still exist, simply because fewer retail investors track it closely. For sophisticated buyers, October’s numbers might feel like a wake-up call to at least look at this category seriously.
Plots – Long-Term Conviction Play
Plots are always a bit abstract for most retail buyers, but in October they had:
399 deals,
Around AED 11B in sales value,
Average prices up 17.7% YoY to about AED 7M.
Plot buyers are usually:
Developers assembling land in emerging corridors (for example, around Wadi Al Safa 5, Dubai South, or Dubai Investment Park 2), or
High-net-worth individuals who want to build bespoke villas in pockets of Dubai that are still evolving.
If you are a pure income investor, plots may feel “too far out”. But if you are thinking in 10–15-year horizons, October’s plot performance is basically the market quietly saying: “We still believe in Dubai 2040.”
Price Brackets – Where Most Money Actually Traded
Another angle that helps you sanity-check the market is price tiers. October’s transactions were spread roughly as follows:
Price Bracket | Share of Transactions | Typical Buyer Profile |
|---|---|---|
Below AED 1M | 28% | First-time buyers, small investors, studio/1BR stock |
AED 1M – 2M | 36% | Core upper-middle segment; bulk of 1–2BR apartments |
AED 2M – 3M | 14% | Larger apartments, entry-level townhouses |
AED 3M – 5M | 12% | Townhouses, mid-range villas, some prime apartments |
Above AED 5M | 10% | Luxury & ultra-luxury, including branded residences |
What I find interesting here is the dominance of the AED 1–2M band. It is big enough to feel aspirational for many expats, but still realistic with a mortgage or structured payment plan.
For brokers and developers, this segment is effectively the engine of the market; for investors, it is where you can often balance liquidity, rentability, and exit options.
If you need help pressure-testing a specific ticket size against rent, service charges, and realistic yields, you may want to cross-check with:
Read: Dubai Property Manager: How to Choose, Compare Fees, and Protect Your Yields
Top Performing Areas – JVC, Business Bay, Wadi Al Safa 5, JVT & More
Now to the inevitable question: where did all those deals happen?
Across multiple October 2025 reports, the same communities keep appearing at the top of the list:
Jumeirah Village Circle (JVC)
Business Bay
Wadi Al Safa 5
Jumeirah Village Triangle (JVT)
Dubai Investment Park 2 (DIP 2)
Some sources give slightly different rankings beyond the top four, but the core pattern is very consistent.
Top 5 Areas by Volume – October 2025
Rank | Area | Approx. Transactions | Notes |
|---|---|---|---|
1 | Jumeirah Village Circle (JVC) | ≈ 1,685 | Volume leader; mixes off-plan and ready apartments; strong rental demand. |
2 | Business Bay | ≈ 1,177 | Central, mixed-use; strong for both investors and end-users. |
3 | Wadi Al Safa 5 | ≈ 1,110 | Fast-growing villa/plot corridor with big off-plan launches. |
4 | Jumeirah Village Triangle (JVT) | (High hundreds) | Townhouse and villa stock; spillover from JVC at higher space per dirham. |
5 | Dubai Investment Park 2 | (High hundreds) | Emerging industrial + residential mix; relatively affordable ticket sizes. |
Let’s very briefly characterize each, from an investor’s perspective.
JVC – The Volume Champion
JVC has now spent several years near the top of Dubai’s transactions rankings, and October 2025 reinforced that trend: around 1,700 sales and roughly AED 2.5B in value, depending on the data set you reference.
Why it keeps winning:
Affordability per ft² compared with more central districts.
A deep inventory of studios and 1–2BRs that match the budgets of young professionals and small families.
Active off-plan pipeline plus a large pool of ready units.
Strong rental demand, which supports yield-focused strategies.
From a buyer’s perspective, JVC is rarely “perfect”. Infrastructure is still patchy in pockets, and quality varies by developer. But that is also why opportunities exist; you can still be selective and outperform the average.
For a more granular, community-level analysis style, see also:
Business Bay – Central, Liquid, and Still Evolving

Business Bay ranked second by volume in October 2025, with about 1,200 sales.
This is a classic mixed-use, city-core bet:
A blend of older stock and newer towers, including branded and waterfront projects.
Very strong appeal to both tenants and investors who want Downtown-adjacent living without Downtown prices.
Good mortgage uptake, which often makes exit flows smoother.
Over the last few years, Business Bay has also become a hotspot for short-term rentals and hybrid-use apartments, though regulatory and supply dynamics mean you really need proper due diligence here rather than just “buy anything”.
Wadi Al Safa 5 & JVT – The Growth Corridors
Wadi Al Safa 5 came in third by volume and is increasingly associated with villa communities and new master-planned stock.
Key features:
Larger unit sizes compared with central apartment districts.
Strong activity in both off-plan villas and plot-led villa projects.
A typical buyer here is often a family or an investor who wants more space for the money, not just a studio in the sky.
Jumeirah Village Triangle (JVT), by contrast, is more established but still evolving, with a mix of:
Townhouses and villas that appeal to upgraders leaving apartments.
Reasonable access to JLT, Dubai Marina, and major highways.
Some investors treat JVT as a complementary play to JVC: they might hold an apartment in JVC for yield and a townhouse in JVT for capital appreciation and lifestyle.
Dubai Investment Park 2 – The Under-the-Radar Player
Dubai Investment Park 2 (DIP 2) does not always grab the headlines, but it consistently appears in the top-activity lists thanks to its blend of industrial, logistics, and residential components.
It is particularly interesting for:
Businesses needing functional space near major transport corridors.
Investors who are comfortable buying into non-glamorous but cash-flow-friendly locations.
If you are purely chasing postcard views, DIP 2 is not for you. If you are chasing cash-on-cash returns, you should at least keep it on your radar.
Rental Market Snapshot – October 2025
Let’s briefly touch the rental side, because it underpins almost every investment thesis in Dubai.
Across the city, average annual rents in October 2025 were roughly:
Property Type | Avg Annual Rent | YoY Change |
|---|---|---|
Apartment | AED 87,000 | +7.4% |
Villa | AED 185,000 | +5.7% |
Commercial | AED 20,000 | -63.6% |
Two quick observations:
Residential rents are still rising meaningfully faster than most salaries, which is partly why more expats are finally choosing to buy instead of renewing leases.
Commercial rents dropped sharply on average, to around AED 20K, reflecting lingering softness in some segments and a re-pricing of older or less well-located stock.
From an investor’s point of view, that combination is almost textbook:
Apartments and mid-market villas remain compelling rental assets, especially in communities like JVC, Dubai Hills Estate, Dubai South, and parts of Business Bay.
Commercial offers potential value opportunities, but only if you can do detailed asset-level analysis; averages are hiding big differences between prime and non-prime space.
From Rents to Real Yields – What October 2025 Really Tells You
So far, we have looked at prices and rents almost separately. October 2025 becomes more interesting when you combine the two and think in terms of yields. That is, what you actually earn every year on the money you put in.
Let’s keep it simple and work with the average prices and rents we already discussed:
Average apartment price: ~AED 1.3M
Average villa price: ~AED 3.9M
Average commercial unit price: ~AED 1.8M
Average apartment rent: AED 87,000/year
Average villa rent: AED 185,000/year
Average commercial rent: AED 20,000/year
If you turn that into very rough gross yields (before service charges, maintenance, vacancy etc.), you get something like this:
Example Gross Yield Snapshot – October 2025
Property Type | Approx Avg Price | Approx Avg Rent (Year) | Gross Yield (Rent ÷ Price) |
|---|---|---|---|
Apartment | AED 1,300,000 | AED 87,000 | ~6.7% |
Villa | AED 3,900,000 | AED 185,000 | ~4.7% |
Commercial | AED 1,800,000 | AED 20,000 | ~1.1% |
These are obviously city-wide averages, not a deal-by-deal view. Real yields vary dramatically between, say, a new 1BR in JVC and a penthouse in Business Bay. But the pattern is clear enough:
Apartments remain the yield workhorses.
Villas have turned into more of a capital and lifestyle play, with price growth outpacing rent growth.
Commercial, at least at the “average” level, looks compressed on yield, and needs more precise asset selection.
If you drill down at community level, you will find many apartments delivering 7–9% gross and some villas that, bought right, still push 5–6%. But October’s stats make one thing obvious: chasing yield blindly, without looking at micro-market data, is a fast way to disappoint yourself.
This is why, at Totality, we tend to pair any “headline yield” with a concrete data sheet: actual service charges, realistic occupancy assumptions, and a conservative exit price. On paper, almost everything in Dubai can be made to look like a 9% deal with optimistic fantasy numbers; in practice, very few are.
If you want a more detailed framework for that sort of analysis, you can later cross-check with:
Who Should Be Doing What in This Market?
One of the questions I hear a lot sounds like this:
“Given these October 2025 stats… what should I actually do?”
There is no universal answer, but the market does treat different buyer profiles differently. Let’s sketch a few.
1. First-Time Buyers (End-Users)
If you are an expat renting in Dubai, watching your annual lease jump again and again, October’s numbers are a gentle nudge:
Rents are still rising faster than apartment prices, at least in many mid-market communities.
Mortgage availability is improving, and down-payment requirements are clear and predictable.
Off-plan can make the entry ticket easier to swallow via staged payments.
But there is a trade-off:
Buying off-plan means accepting construction and handover risk, plus the usual uncertainty about community maturity.
Buying ready means facing a heavier upfront cost, but you see exactly what you are getting and you can move in or rent out immediately.
If I had to summarize October for first-time buyers:
It is not “cheap”, but it is still rational — especially if you plan to stay 5–7 years or more and choose a liquid area like JVC, Business Bay, Marina, or an emerging hub such as Dubai South.
2. Yield-Focused Investors
For investors who think in spreadsheets, October 2025 is actually quite friendly:
Apartment prices are flattening in some segments while rents keep pushing up.
You still have communities (especially in JVC, parts of Dubai South, and some fringe zones) where gross yields above 7–8% are achievable with the right unit.
Off-plan, if you buy at launch in the right project, can deliver equity upside during construction plus a solid yield on completion.
But again, this only works if you screen deals properly. Same community, two towers across the street, and your net yield can differ by two full percentage points because of service charges, building quality, and real tenant demand.
This is where using data tools and comparison tables becomes more than a nice-to-have; it becomes a risk-control mechanism. (Internally, we use our own filters and scoring models; you can replicate some of that thinking with a disciplined Excel or Sheets approach.)
3. Capital-Growth Hunters and “Upgraders”
If you are less concerned with yield and more with wealth growth and lifestyle—for example, trading an apartment for a townhouse or villa—the October villa numbers are a double-edged sword:
Yes, villa prices surged about 20% year-on-year on average.
But transaction volumes fell sharply, which hints at thinning affordability and more selective demand.
In simple terms:
If you already own a villa bought in 2022–2023, October is probably flattering your equity.
If you are trying to enter the villa market now, you need to be very deliberate about location, infrastructure, and future supply.
Communities in corridors like Wadi Al Safa 5, Dubai Hills Estate, and parts of Arabian Ranches extensions are still seeing strong interest. Others may be at risk of overshooting.
Risks and Early-Warning Signals to Watch
It is tempting to only talk about upside. But real investors tend to sleep better when they have a small list of “red flags” pinned above their desk. October 2025, despite the strong numbers, is no exception.
Here are a few things worth watching, especially if you are entering the market now:
1. Over-Concentration in One Segment
If almost all of your portfolio is in:
One area (for example, only JVC studios), or
One developer, or
One property type (say, only off-plan 1BRs),
then you are basically betting your future on a very narrow story. October’s data shows that different property types and areas move on different cycles. That is both a risk and an opportunity.
2. Too Much Leverage, Not Enough Buffer
Mortgage counts are rising, which is healthy… up to a point. Problems tend to start when:
EMIs are set at the upper edge of what your income allows;
You have no cash buffer for void periods, maintenance, or surprise special levies;
Your plan quietly assumes zero interest-rate volatility.
A market can be fundamentally sound, yet individual investors get squeezed simply because they left no room for normal bumps in the road.
3. Ignoring Service Charges and Real Running Costs
If a Dubai property looks too good to be true based purely on price and rent, it almost always has a catch:
High service charges,
Weak maintenance history,
Poor tenant demand (you can list, but nobody bites at your asking rent),
Or regulatory friction for holiday homes or business use.
One practical tip: when you assess a deal, always calculate yields after service charges and realistic vacancy. The gap between gross and net is where many “9%” stories quietly drop to 5–6% in real life.
How to Use October 2025 Stats in Your Own Strategy
Numbers are only valuable if they change what you do. Here is a simple way to turn October 2025 market stats into an actual roadmap.
Step 1 – Decide Your Primary Objective
Are you mostly:
Trying to stop paying rent and secure a home?
Building a yield-focused portfolio over the next 3–5 years?
Positioning for capital growth in selected corridors?
Write it down. It sounds trivial, but a surprising number of people buy in Dubai without a clearly articulated “why”.
Step 2 – Choose 2–3 Micro-Markets, Not 20
Based on October’s activity and pricing, a lot of investors will naturally shortlist areas like:
Jumeirah Village Circle (JVC) – depth, liquidity, yields.
Business Bay – central, mixed-use, more premium.
Emerging villa and plot corridors like Wadi Al Safa 5.
Rather than half-studying 20 communities, pick two or three and really understand:
Current price per ft² ranges,
Typical rents and yields,
Upcoming supply (new towers, new phases),
Developer quality and reputation.
If you want an example of how to structure a deeply focused, data-led community guide, take a quick look at:
Step 3 – Stress-Test Two or Three Actual Deals
Instead of dreaming in averages, pick real listings or launches and run them through your model:
Entry price, all-in closing cost, and payment plan.
Realistic rent (not the rosiest possible).
Service charges and maintenance allowance.
5–7-year exit assumption, with a reasonable, not heroic, capital growth rate.
You will immediately see which projects survive a sober stress-test and which ones only look good on glossy brochures.
Step 4 – Get a Second Pair of Eyes
Finally, and this is more of an opinion than a rule: I think it is wise to get someone who lives and breathes this market to challenge your assumptions. Not to sell you something, but to play devil’s advocate on your behalf.
If you would like that kind of conversation, you can always use the contact channels on the main site:
Start your Dubai investment strategy with Totality Real Estate
October 2025 in the Bigger Picture (2026–2030 View)
If you step back from the spreadsheets for a moment, October 2025 feels like a checkpoint, not a turning point. The market did not crash. It did not explode higher. It rebalanced.
A few themes stand out that are likely to matter for the next five years:
Off-plan is still the main engine.
With roughly 70% of transactions coming from new launches, Dubai is clearly leaning into its development pipeline. That is unlikely to reverse overnight. As long as employment, population, and infrastructure keep expanding, this off-plan bias can stay healthy.Villas and plots are signaling long-term conviction.
Prices for villas, commercial units, and plots moved up sharply year-on-year, even with softer transaction volumes in some segments. That usually reflects a bet on Dubai 2030, not just 2026.Apartments are drifting toward a yield story.
Apartment prices barely moved compared with rents, which rose faster. For many investors, that is the quiet sweet spot: sensible entry prices and improving gross yields.Risk is becoming more localised, not systemic.
The danger now is less “Dubai collapse” and more “I picked the wrong tower in the right community”. Micro-level selection matters more than ever.
If I had to sketch three simple scenarios for 2026–2030 based on October’s tone, they might look like this:
Base case:
Transaction volumes hover at high-but-normalised levels.
Prices grow modestly, with apartments and mid-market communities tracking income and demographic growth.
Rents continue to outpace inflation for a while, then stabilise.
Upside case:
Global capital keeps rotating into “safe, tax-efficient hubs”.
Dubai’s major infrastructure and tourism projects overdeliver.
Prime and ultra-prime segments, plus key corridors (Business Bay, Dubai Creek Harbour, Dubai South, Dubai Islands, etc.) post outsized gains.
Downside / risk case:
Some corridors see over-supply or over-optimistic pricing, especially in cookie-cutter launches.
Global shocks or tighter financing trigger a patchy correction, more visible in speculative pockets than in established, end-user-heavy communities.
The October 2025 data does not scream “bubble”, but it does whisper “choose carefully”.
If you are building a serious plan rather than hunting for a lucky flip, it may be worth pairing this article with a deeper, project-level read like:
Dubai Off-Plan Properties: Goldmine or Death Trap?
and
Dubai Rental Market 2025–2030 Outlook: Trends, Yields, and Investment Insights
Together, they give you both the monthly snapshot and the cycle narrative.
FAQs: Dubai Sales Stats October 2025
You can use this section as-is or trim it down. I will keep the tone straightforward but still human.
How many property transactions took place in Dubai in October 2025?
Dubai recorded roughly 18,000–19,875 property transactions in October 2025, depending on the data source and inclusion of certain categories. The key point is that volumes were slightly lower (about 3% down year-on-year), but still historically high.
What was the total real estate sales value for Dubai in October 2025?
Total real estate sales value in October 2025 was in the range of AED 58.58–59.4 billion. Even with a small dip in transaction numbers compared with October 2024, overall dirham volume remained strong due to higher average prices.
Did Dubai property prices go up or down in October 2025?
On average, prices went up, especially when measured per square foot. The city-wide average price per square foot reached around AED 1,692, up roughly 6–7% year-on-year, even though apartments as a category saw a very small 0.5% dip in average ticket price.
How big was the off-plan share in October 2025?
Off-plan (first sales) accounted for around 70% of transactions and about 65% of total sales value in October 2025. That confirms that new launches and master-planned communities are still driving Dubai’s market.
Which property type performed best in October 2025?
It depends how you define “best”:
Apartments dominated by volume and remain the main liquidity pool.
Villas saw strong price growth (around +20.5% YoY) but fewer transactions.
Commercial units and plots notched some of the strongest price increases, signalling growing conviction in long-term business and development demand.
What were the top areas for sales in October 2025?
The most active areas included Jumeirah Village Circle (JVC), Business Bay, Wadi Al Safa 5, Jumeirah Village Triangle (JVT), and Dubai Investment Park 2. JVC and Business Bay remained volume leaders, while Wadi Al Safa 5 and JVT saw strong villa and plot activity.
How did rents move in October 2025?
City-wide, apartment rents increased by around 7.4% year-on-year, villa rents by about 5.7%, while commercial rents fell sharply (around -63.6% on average), reflecting re-pricing in certain office and retail segments.
What kind of yields can investors expect from Dubai property?
Using October 2025 averages as a rough guide:
Apartments: around 6–7% gross yield.
Villas: approximately 4–5% gross yield.
Commercial units: much lower on average, around 1–2%, though individual assets can be higher.
Real-life yields depend heavily on location, building quality, service charges, and realistic rents.
Is now a good time to buy property in Dubai based on October 2025 data?
There is no universal “yes” or “no”, but October’s stats suggest a rational, not frothy market:
Rents are still rising, especially for apartments.
Prices are up, but not in a straight-line spike.
Mortgage activity is growing, which supports end-user demand.
For many buyers with a 5–7-year horizon—and who choose the right community—the data supports building or expanding a position, as long as the numbers work on a property-by-property basis.
How can I turn these October 2025 stats into an actual investment plan?
A practical way forward is to:
Decide whether your priority is homeownership, yield, or capital growth.
Shortlist 2–3 communities that match that goal (for example, JVC, Business Bay, Dubai South, or Dubai Islands).
Stress-test a few real deals with conservative rent and cost assumptions.
Get a professional, data-driven second opinion before you commit.
If you want help with that process, you can always reach out.