
Volumes cooled. Prices did not. That gap is the whole October 2025 story, and it is worth more than any headline about record months.
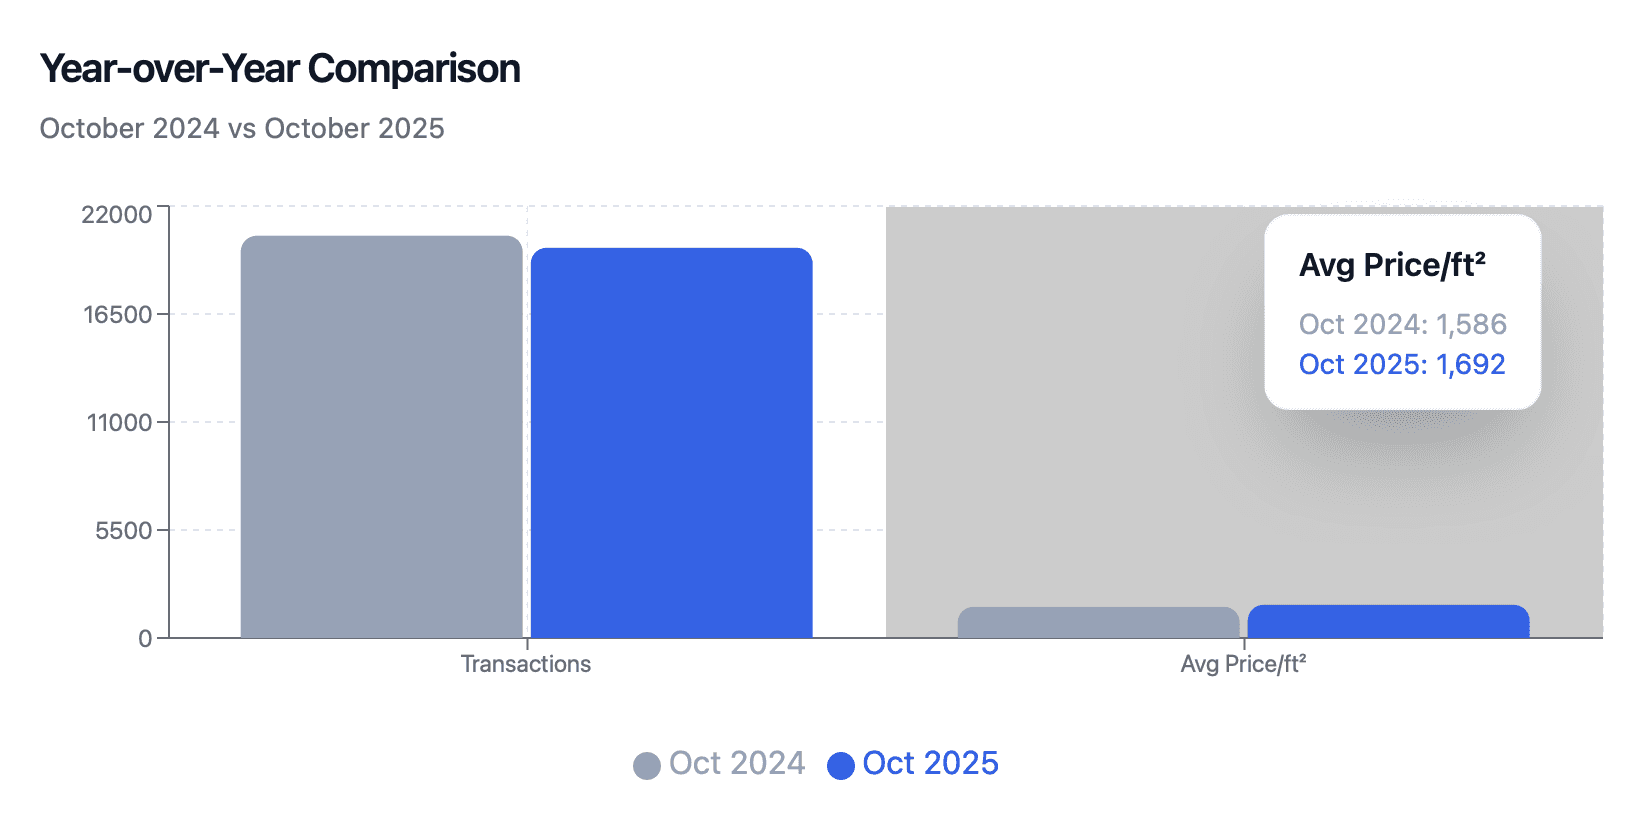
Dubai recorded roughly 19,875 property sales in October 2025, worth about AED 59.4 billion, per DLD and DXB Interact analyses. That is around 3% fewer transactions than October 2024. Yet buyers paid more per square foot, an average of AED 1,692/ft², up roughly 6.7% year-on-year.
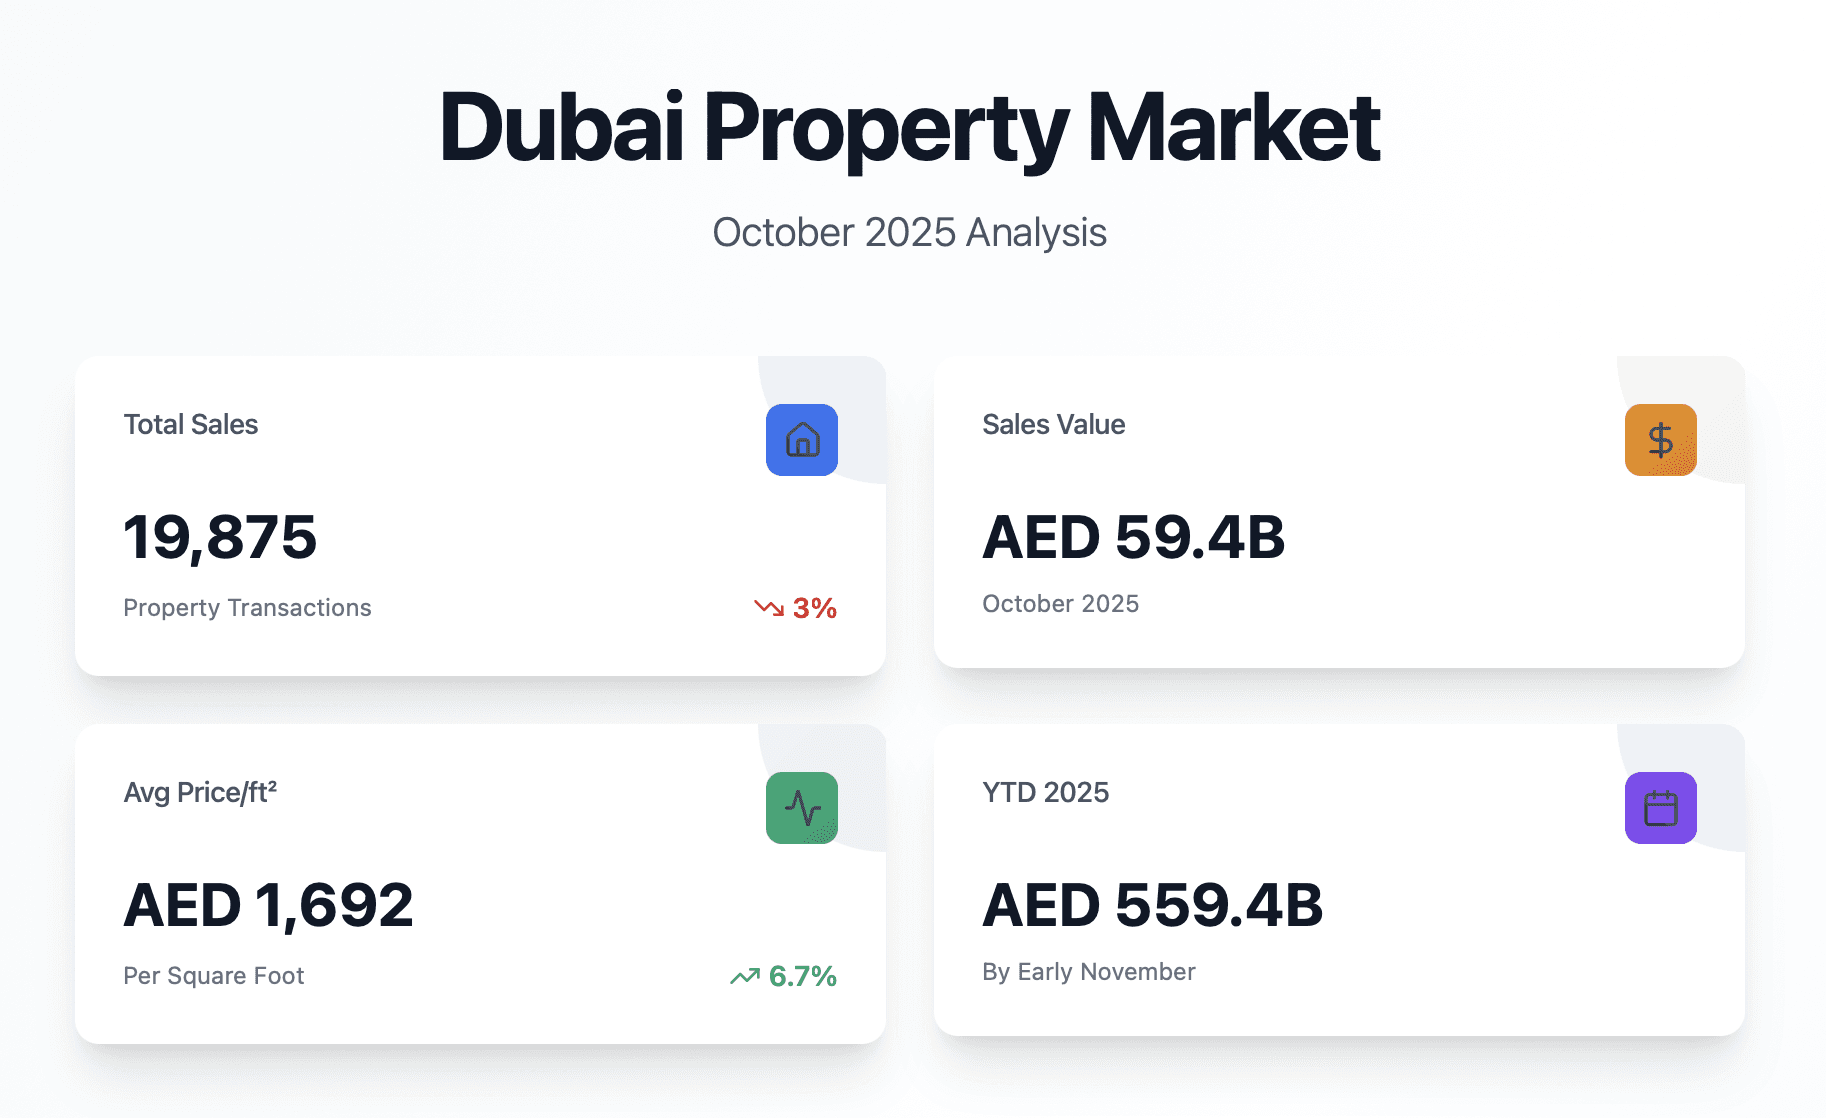
When volume slips and price per foot rises, the market is usually getting more selective, not weaker. Fewer deals, more serious buyers. In October, people were paying up for the right asset rather than just getting a foot in the door.
The structure underneath tells you where they went. Off-plan still dominated at about 70% of transactions and 65% of value. Resales made up the remaining 30% of deals and 35% of value, liquid but clearly not leading.
Zoom out and the year is even more striking. By early November, Dubai had crossed AED 559.4 billion in year-to-date sales, already past 2024’s full-year total. October is one tile in that mosaic. A useful one if you are timing your next move.
The headline numbers, and what they hide
| Metric | October 2025 | YoY vs Oct 2024 | Notes |
|---|---|---|---|
| Total transactions | ~19,875 (range 18,232 to 19,875) | -3% approx. | Slight cooling after a record 2024 |
| Total sales value | ≈ AED 59.4 billion | ≈ +3.1% | Higher value despite fewer deals |
| Average price per sq ft | AED 1,692 | +6.7% | Buyers paying more per foot |
| Off-plan share (volume) | ~70% | Up vs pre-2022 | Developers drive most of the action |
| Resale share (volume) | ~30% | Slightly subdued | Secondary still deep, not leading |
| Mortgages (transactions) | 4,880 | +12.9% | More end-users and leveraged investors |
| Mortgages (value) | AED 16.6 billion | +2.3% | Debt growing, not overheating |
Put October in its decade. Average price per foot has climbed from about AED 981 in 2014 to roughly AED 1,688 to 1,692 in 2025. Monthly transactions this year swung between around 14,000 and 20,000, and October sat near the top of that range. So this is not an outlier spike. It is a sustained high-activity cycle that is gently normalising in volume after the post-pandemic surge. That pattern rewards disciplined buyers who track micro-markets, developer behaviour and payment plans, not headlines.
Where the money actually went: off-plan vs secondary
If you remember one structural fact about October, make it this: roughly 70% of deals were off-plan first sales, carrying about 65% of the month’s value. Resales took the other 30% of transactions and 35% of value.
| Segment | Volume share | Value share | What it signals |
|---|---|---|---|
| Off-plan (1st sale) | ~70% | ~65% | Trust in new launches, payment plans, a 3 to 5 year outlook |
| Secondary / resale | ~30% | ~35% | Solid liquidity, less headline noise than launches |
Three reasons this keeps repeating. First, payment plans win on psychology. Spreading equity over 3 to 5 years with a post-handover slice is easier to stomach than a heavy down payment on a ready unit, even when the IRR lands in a similar place. Second, buyers want the story. Off-plan launches in JVC, Dubai South, Dubai Islands, Business Bay extensions and branded towers like the Bulgari Lighthouse or Peninsula series feel like buying into Dubai 2030, not just a flat. Third, developers keep the funnel full with incentives, fee waivers, DLD offers and creative handover structures. In October, Damac Riverside, Binghatti Flare and Nad Al Sheba First led on volume and value.
The secondary market is not dead. It is more rational. More mortgage-backed buyers, more price sensitivity on older stock, stronger activity in well-run communities where yields are proven rather than promised.
Read: Dubai Off-Plan Properties: Goldmine or Death Trap?, a data-led look at launch cycles, payment plans and exit strategies.
Mortgages: the quiet signal that matters
Mortgage data gets buried in most monthly reports, which is a shame because it tells you about the health of the ecosystem. October registered 4,880 mortgage deals worth AED 16.6 billion. That is about 12.9% more loans than October 2024, with value up around 2.3%.
What it means in practice: a growing share of buyers are end-users and long-term expats, not only cash-rich speculators. Banks are still comfortable with Dubai’s risk profile, if they were nervous you would see tighter lending or much softer loan growth. And for investors, financed end-users support exit liquidity, especially in established areas like Business Bay, JLT, Dubai Marina and mature JVC. I think of expanding mortgage finance as the oxygen of the market. Prices move around, launches ebb and flow, but if lending is growing the system is breathing.
Four property types, four different stories
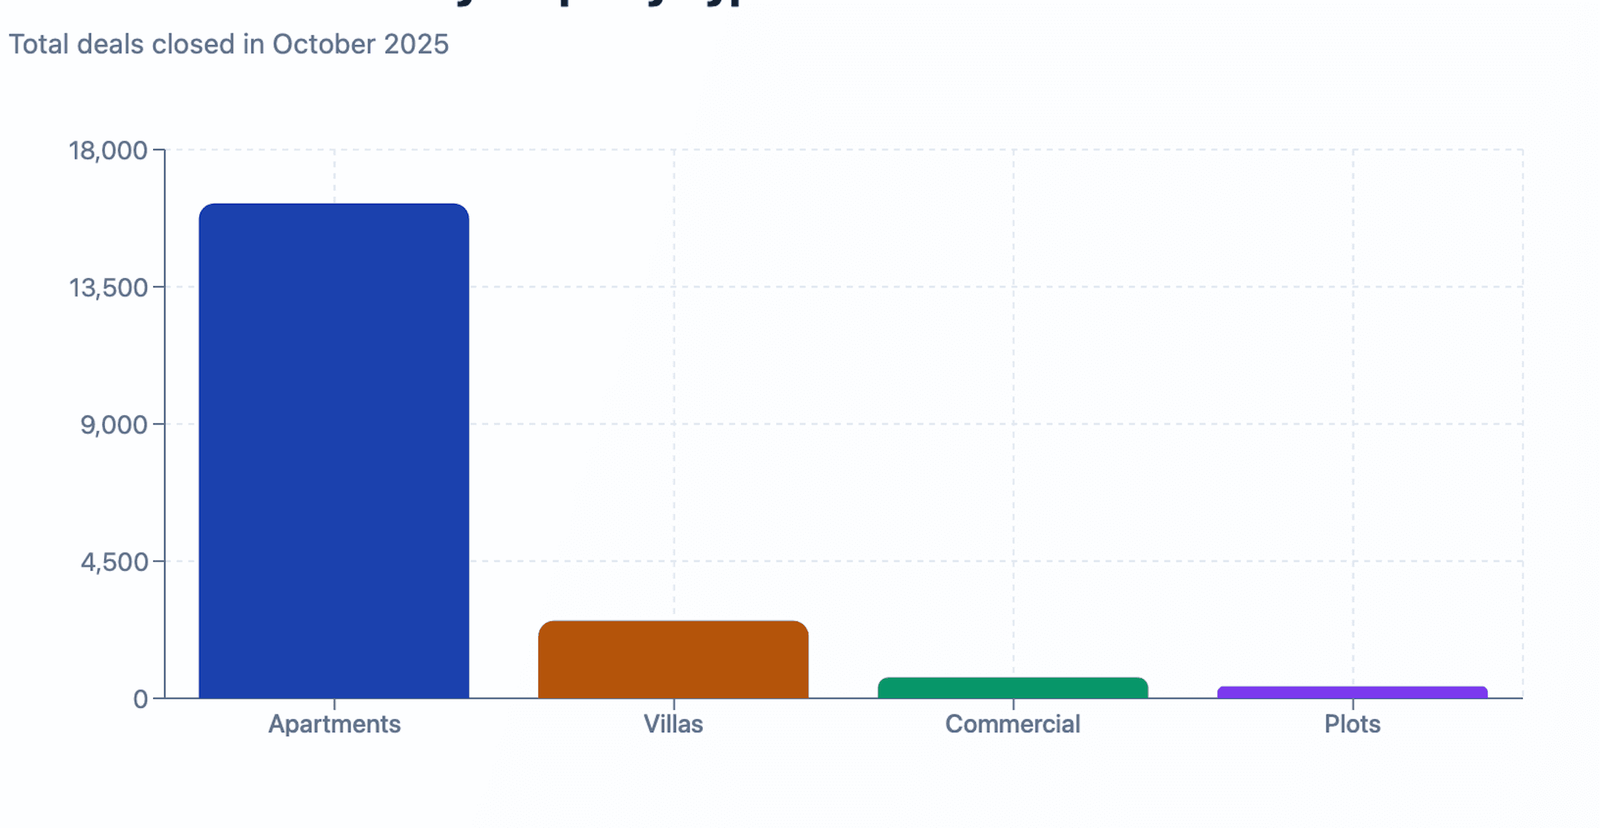
Same city, same month, and each property type behaved completely differently. Per DLD and DXB Interact reports:
- Apartments: 16,238 transactions (+3.4% YoY), about AED 31 billion
- Villas: 2,549 transactions (-36.8% YoY), about AED 15.5 billion
- Commercial units: 689 deals (+61.7% YoY), about AED 1.9 billion
- Plots: 399 deals (+23.9% YoY), about AED 11 billion
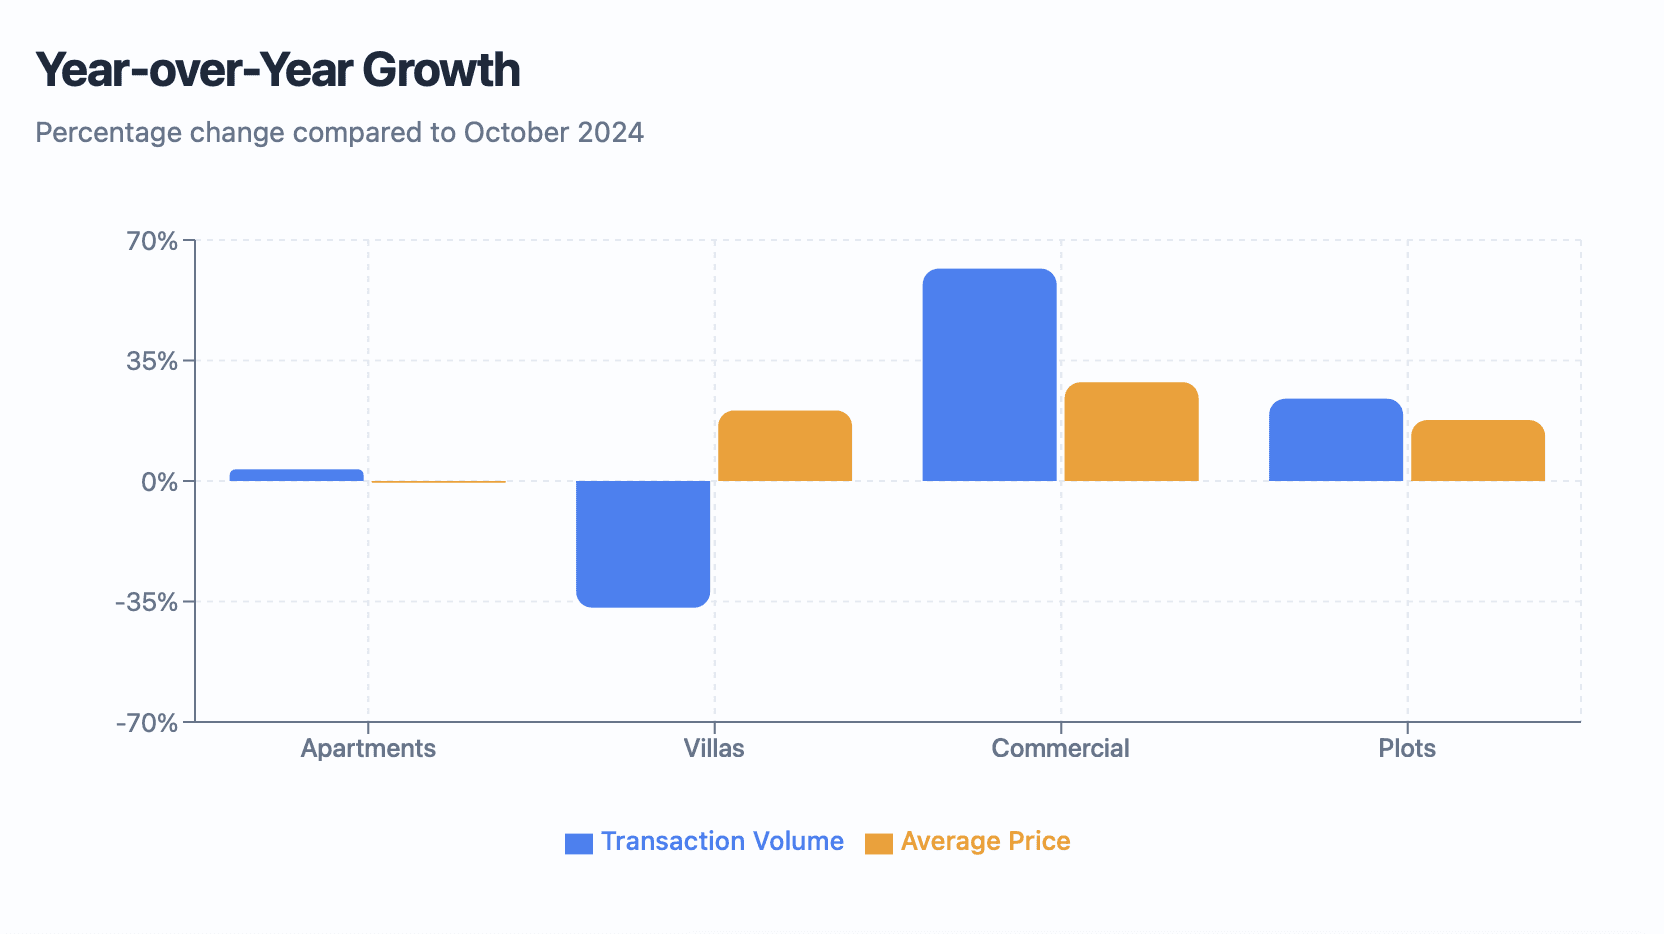
Average ticket prices moved in their own directions. Apartments averaged AED 1.3M (-0.5% YoY), villas AED 3.9M (+20.5%), commercial AED 1.8M (+28.7%), plots AED 7M (+17.7%).
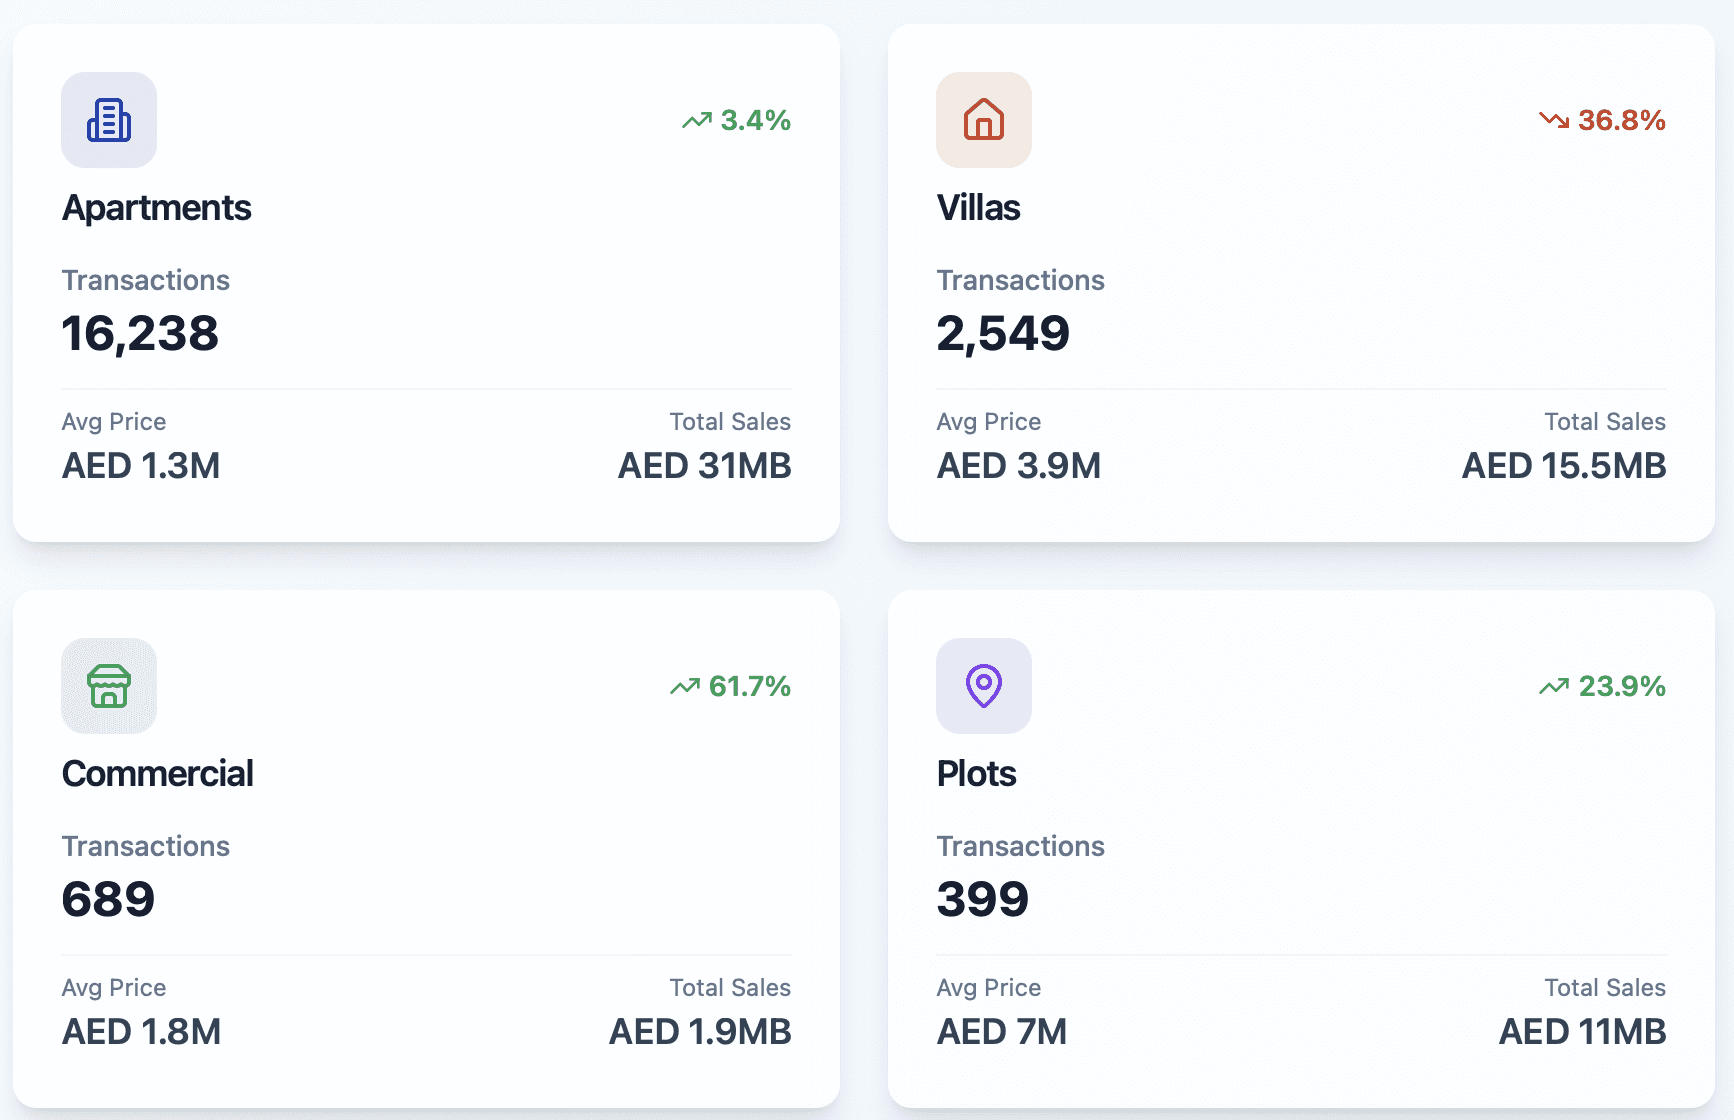
| Type | Transactions | Sales value | Share of value | Avg ticket | YoY price |
|---|---|---|---|---|---|
| Apartments | 16,238 | ~AED 31B | 52% | AED 1.3M | -0.5% |
| Villas | 2,549 | ~AED 15.5B | 26% | AED 3.9M | +20.5% |
| Plots | 399 | ~AED 11B | 18% | AED 7M | +17.7% |
| Commercial | 689 | ~AED 1.9B | 3% | AED 1.8M | +28.7% |
Numbers rounded, based on aggregated October 2025 reports and DXB Interact data.
Apartments: volume king, price on pause
Apartments are the backbone. Over 16,000 deals and 52% of all value. But the average price dipped about 0.5% YoY even as transaction counts rose. Buyers are trading down in ticket size or shifting toward more affordable locations, and the wave of new mid-market supply is capping city-wide price acceleration. Quietly, apartments are turning into a yield play rather than a capital-gain story. For a rental portfolio that is not bad news at all: a flat entry price against rising rents means improving net yield over time.
Read: Dubai Rental Market 2025 to 2030 Outlook: Trends, Yields, and Investment Insights
Villas: fewer deals, much higher prices
Villas did the opposite. Transactions fell about 36.8% YoY while the average price jumped about 20.5% to around AED 3.9M. That combination usually means a base effect from an unusually strong 2024, a tilt toward prime and ultra-prime stock, and owners in established districts who are no longer willing to sell cheap. Anyone who bought a villa in 2022 or 2023 is sitting on real equity. New buyers in October were paying up for lifestyle more than yield. Not overheated on one month of data, but not the bargain rack either.
Commercial: the quiet overachiever
Commercial rarely comes up in casual conversation, and in October it was the strongest mover on paper. Transactions up 61.7% YoY, average prices up 28.7%, yet still only 3% of total value. Tiny headline share, meaningful signal. Businesses are locking in office and retail space at rates that still look cheap against global cities, and some buyers are positioning for population growth in Dubai South, Dubai Islands and parts of Business Bay. It is also where mispricing survives, because few retail investors track it closely.
Plots: the long-horizon bet
Plots are abstract for most buyers. In October there were 399 deals, around AED 11B in value, average prices up 17.7% YoY to about AED 7M. The buyers are developers assembling land in corridors like Wadi Al Safa 5, Dubai South and Dubai Investment Park 2, and high-net-worth individuals building custom villas. If you invest for income, plots feel too far out. If you think in 10 to 15 year horizons, this is the market saying it still believes in Dubai 2040.
Which price bands did the trading
| Price bracket | Share of deals | Typical buyer |
|---|---|---|
| Below AED 1M | 28% | First-time buyers, small investors, studio and 1BR stock |
| AED 1M to 2M | 36% | Core upper-middle segment, most 1 to 2BR apartments |
| AED 2M to 3M | 14% | Larger apartments, entry townhouses |
| AED 3M to 5M | 12% | Townhouses, mid-range villas, some prime apartments |
| Above AED 5M | 10% | Luxury and ultra-luxury, branded residences |
The AED 1 to 2M band is the engine. Aspirational enough for many expats, realistic with a mortgage or a structured plan. It is where you can balance liquidity, rentability and exit options. Before you commit to a ticket size, pressure-test it against rent, service charges and honest yields.
Read: Dubai Property Manager: How to Choose, Compare Fees, and Protect Your Yields
Where the deals happened
Across October reports the same communities kept surfacing: Jumeirah Village Circle, Business Bay, Wadi Al Safa 5, Jumeirah Village Triangle and Dubai Investment Park 2. Rankings shift a little below the top four, but the core pattern is consistent.
| Rank | Area | Approx. deals | Notes |
|---|---|---|---|
| 1 | JVC | ≈ 1,685 | Volume leader, mixes off-plan and ready, strong rental demand |
| 2 | Business Bay | ≈ 1,177 | Central, mixed-use, works for investors and end-users |
| 3 | Wadi Al Safa 5 | ≈ 1,110 | Fast-growing villa and plot corridor with big launches |
| 4 | JVT | High hundreds | Townhouse and villa stock, more space per dirham than JVC |
| 5 | DIP 2 | High hundreds | Industrial plus residential mix, affordable tickets |
JVC: the volume champion
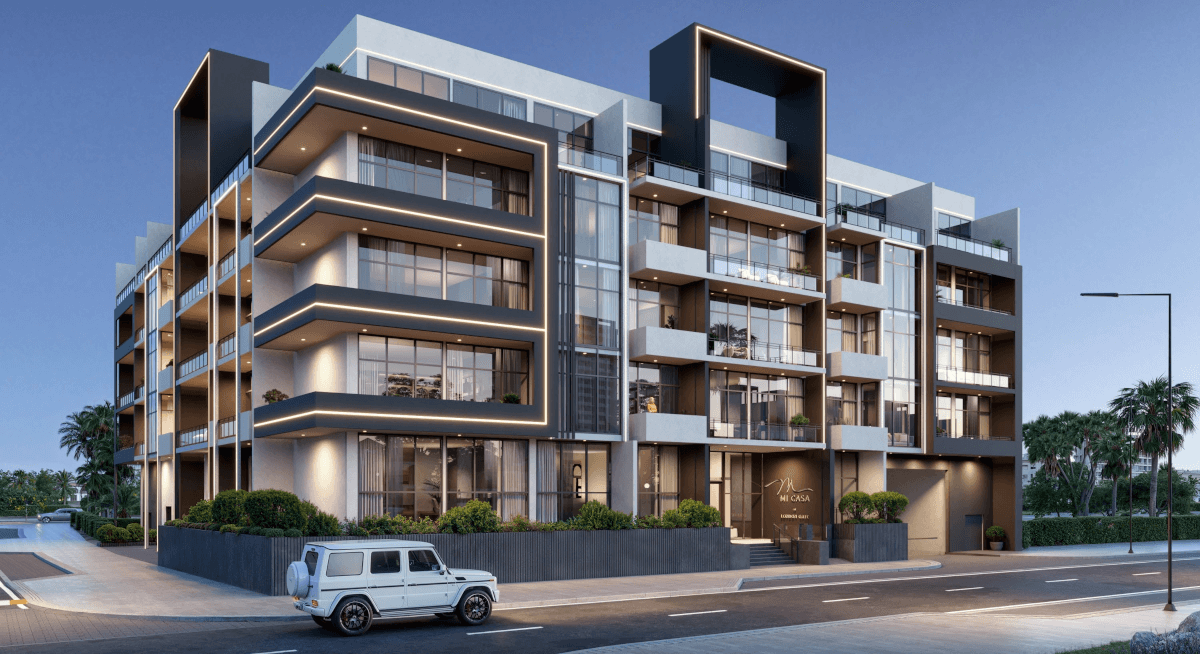
JVC has sat near the top of Dubai’s rankings for years, and October reinforced it with around 1,700 sales and roughly AED 2.5B in value depending on the dataset. It wins on affordability per foot, a deep pool of studios and 1 to 2BRs that fit young professionals and small families, an active off-plan pipeline alongside plenty of ready units, and rental demand that supports yield strategies. JVC is rarely perfect. Infrastructure is patchy in pockets and quality swings by developer. That is exactly why you can be selective and beat the average.
Business Bay: central, liquid, still evolving
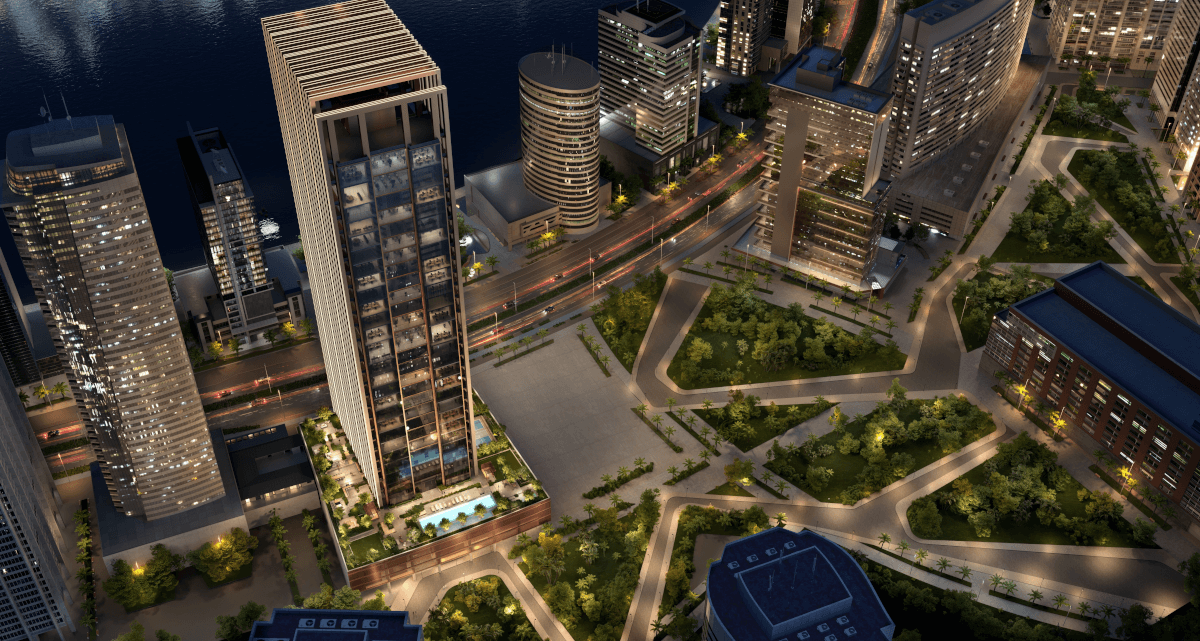
Business Bay came second with about 1,200 sales. It is the classic city-core bet: older stock next to new towers, including branded and waterfront projects, strong appeal to tenants and investors who want Downtown-adjacent living without Downtown prices, and healthy mortgage uptake that smooths exits. It has also become a hotspot for short-term rentals, though regulation and supply mean you do proper due diligence here, not “buy anything”.
Wadi Al Safa 5 and JVT: the growth corridors
Wadi Al Safa 5 ranked third and is increasingly about villa communities and master-planned stock, with larger units and heavy activity in off-plan and plot-led villa projects. The buyer is usually a family or an investor who wants space, not a studio in the sky. JVT is more established but still maturing, with townhouses and villas that appeal to upgraders leaving apartments and reasonable access to JLT, Dubai Marina and the highways. Some investors run the two together: a JVC apartment for yield, a JVT townhouse for appreciation and lifestyle.
DIP 2: under the radar
Dubai Investment Park 2 rarely grabs headlines but keeps showing up in top-activity lists thanks to its mix of industrial, logistics and residential components. It suits businesses that need functional space near transport corridors and investors comfortable buying cash-flow-friendly locations over postcard views. If you chase views, skip it. If you chase cash-on-cash returns, keep it on the radar.
Rents, and the yields underneath them
Rents underpin almost every investment thesis in Dubai. City-wide averages in October:
| Type | Avg annual rent | YoY |
|---|---|---|
| Apartment | AED 87,000 | +7.4% |
| Villa | AED 185,000 | +5.7% |
| Commercial | AED 20,000 | -63.6% |
Residential rents are still rising faster than most salaries, which is why more expats are choosing to buy rather than renew. Commercial rents dropped sharply on average, reflecting a re-pricing of older or poorly located stock. Now pair rents with prices for rough gross yields, before service charges, maintenance and vacancy:
| Type | Avg price | Avg rent | Gross yield |
|---|---|---|---|
| Apartment | AED 1,300,000 | AED 87,000 | ~6.7% |
| Villa | AED 3,900,000 | AED 185,000 | ~4.7% |
| Commercial | AED 1,800,000 | AED 20,000 | ~1.1% |
These are city-wide averages, not deals. A new 1BR in JVC and a penthouse in Business Bay live in different worlds. But the pattern holds: apartments are the yield workhorses, villas have become a capital and lifestyle play with price growth outrunning rent growth, and commercial looks compressed at the average and needs precise asset selection. At community level you will find apartments at 7 to 9% gross and villas that, bought right, still push 5 to 6%. Chasing yield blindly, without micro-market data, is the fast way to disappoint yourself. Pair any headline yield with the real service charge, an honest occupancy assumption and a conservative exit price. On paper almost anything in Dubai can be made to look like a 9% deal. In practice, very few are.
So what should you actually do?
No universal answer, because the market treats buyer profiles differently.
First-time buyers
If you are renting and watching your lease climb every year, October is a nudge. Rents are still rising faster than apartment prices in many mid-market communities, mortgage availability is improving with clear down-payment rules, and off-plan makes the entry ticket easier through staged payments. The trade-off is real: off-plan means construction and handover risk plus uncertainty about how the community matures, while ready costs more upfront but you see exactly what you get and can move in or rent immediately. October is not cheap, but it is rational if you plan to stay 5 to 7 years and pick a liquid area like JVC, Business Bay, Marina or Dubai South.
Yield-focused investors
October is friendly to spreadsheet thinkers. Apartment prices are flattening while rents push up, some communities still deliver gross yields above 7 to 8% with the right unit, and off-plan bought at launch in the right project can hand you equity upside during construction plus a solid yield on completion. It only works if you screen properly. Same community, two towers across the street, and net yield can differ by two full points because of service charges, build quality and real tenant demand. A disciplined comparison table stops being a nice-to-have and becomes risk control.
Capital-growth hunters and upgraders
If you care more about wealth and lifestyle, say trading an apartment for a villa, the October villa numbers cut both ways. Prices surged around 20% year-on-year, but volumes fell sharply, which hints at thinning affordability and more selective demand. If you already own a villa from 2022 or 2023, October is flattering your equity. If you are entering now, be very deliberate about location, infrastructure and future supply. Corridors like Wadi Al Safa 5, Dubai Hills Estate and parts of the Arabian Ranches extensions still see strong interest. Others risk overshooting.
Red flags worth pinning above your desk
The strong numbers do not cancel the risks. A short list keeps you honest.
Over-concentration. If nearly all your portfolio sits in one area, one developer or one property type, you are betting your future on a very narrow story. October’s data shows property types and areas moving on different cycles. That is a risk and an opportunity.
Too much leverage, no buffer. Rising mortgage counts are healthy up to a point. Trouble starts when the EMI sits at the top edge of your income, you have no cash reserve for voids, maintenance or a surprise levy, and your plan quietly assumes zero rate volatility. A sound market can still squeeze an individual investor who left no room for normal bumps.
Ignoring running costs. If a property looks too good on price and rent alone, it usually has a catch: high service charges, weak maintenance history, thin tenant demand, or regulatory friction on holiday-home or business use. Always calculate yield after service charges and realistic vacancy. The gap between gross and net is where many “9%” stories quietly become 5 to 6%.
Turning the stats into a plan
Numbers only matter if they change what you do.
Decide your objective. Stop paying rent, build a yield portfolio over 3 to 5 years, or position for capital growth in select corridors. Write it down. A surprising number of people buy in Dubai without a clear “why”.
Pick 2 or 3 micro-markets, not 20. Based on October’s activity, most investors will shortlist JVC for depth, liquidity and yield, Business Bay for central mixed-use, and an emerging villa or plot corridor like Wadi Al Safa 5. Then really learn them: current price-per-foot ranges, typical rents and yields, upcoming supply, and developer reputation.
Stress-test real deals. Take actual listings or launches, not averages, and run them: entry price, all-in closing cost and payment plan, realistic rent rather than the rosiest number, service charges and maintenance, a 5 to 7 year exit with a reasonable growth rate. You will see fast which projects survive a sober test and which only shine on the brochure.
Get a second pair of eyes. Have someone who lives in this market challenge your assumptions, not to sell you something but to play devil’s advocate on your behalf. If you want that conversation, reach out through Totality Real Estate.
Where this sits in the 2026 to 2030 picture
October 2025 reads like a checkpoint, not a turning point. The market did not crash and did not explode. It rebalanced. A few themes look likely to carry the next five years. Off-plan stays the main engine while employment, population and infrastructure keep expanding. Villas and plots signal long-term conviction, with prices up sharply even on softer volumes. Apartments drift toward a yield story, with prices barely moving as rents rise faster. And risk becomes localised rather than systemic: the danger now is less “Dubai collapse” and more “I picked the wrong tower in the right community”.
Three rough scenarios follow from October’s tone. In the base case, volumes stay high but normalised, prices grow modestly with apartments tracking income and demographics, and rents outpace inflation for a while before stabilising. In the upside case, global capital keeps rotating into tax-efficient hubs, Dubai’s infrastructure and tourism projects overdeliver, and prime stock plus key corridors like Business Bay, Dubai Creek Harbour, Dubai South and Dubai Islands post outsized gains. In the downside case, some corridors over-supply or over-price, especially cookie-cutter launches, and a global shock or tighter financing triggers a patchy correction that shows up more in speculative pockets than in established, end-user communities.
The data does not scream bubble. It whispers “choose carefully”.
Dubai Off-Plan Properties: Goldmine or Death Trap?
and
Dubai Rental Market 2025 to 2030 Outlook: Trends, Yields, and Investment Insights
FAQs
How many property transactions took place in Dubai in October 2025?
Roughly 18,000 to 19,875, depending on the source and which categories are included. Volumes were down about 3% year-on-year but still historically high.
What was the total sales value?
Between AED 58.58 and 59.4 billion. Even with fewer deals than October 2024, total dirham volume stayed strong because average prices rose.
Did prices go up or down?
Up on average, especially per square foot. The city-wide average reached around AED 1,692/ft², up roughly 6 to 7% year-on-year, even though apartments as a category slipped about 0.5% on average ticket price.
How big was the off-plan share?
Around 70% of transactions and about 65% of value. New launches and master-planned communities are still driving the market.
Which property type performed best?
Depends how you define best. Apartments dominated by volume and remain the main liquidity pool. Villas saw the strongest price growth at about +20.5% YoY but fewer deals. Commercial units and plots posted the strongest price increases, signalling conviction in long-term business and development demand.
What were the top areas?
Jumeirah Village Circle, Business Bay, Wadi Al Safa 5, Jumeirah Village Triangle and Dubai Investment Park 2. JVC and Business Bay led on volume, while Wadi Al Safa 5 and JVT saw strong villa and plot activity.
How did rents move?
Apartment rents rose about 7.4% YoY, villa rents about 5.7%, while commercial rents fell sharply, around -63.6% on average, reflecting re-pricing in parts of the office and retail market.
What yields can investors expect?
Using October averages as a rough guide, apartments around 6 to 7% gross, villas about 4 to 5%, and commercial much lower on average at around 1 to 2% though individual assets can beat that. Real yields hinge on location, build quality, service charges and realistic rents.
Is now a good time to buy?
No universal yes or no, but October reads as rational rather than frothy. Rents are still rising, especially for apartments. Prices are up but not spiking in a straight line. Mortgage activity is growing, which supports end-user demand. For a buyer with a 5 to 7 year horizon who picks the right community, the data supports building or expanding a position, as long as the numbers work property by property.
How do I turn these stats into a plan?
Decide whether your priority is homeownership, yield or capital growth. Shortlist 2 or 3 communities that fit, for example JVC, Business Bay, Dubai South or Dubai Islands. Stress-test a few real deals with conservative rent and cost assumptions. Then get a data-driven second opinion before you commit. If you want help with that process, reach out.